Open source · MIT

Real-time Linux profiling,
straight in your browser.

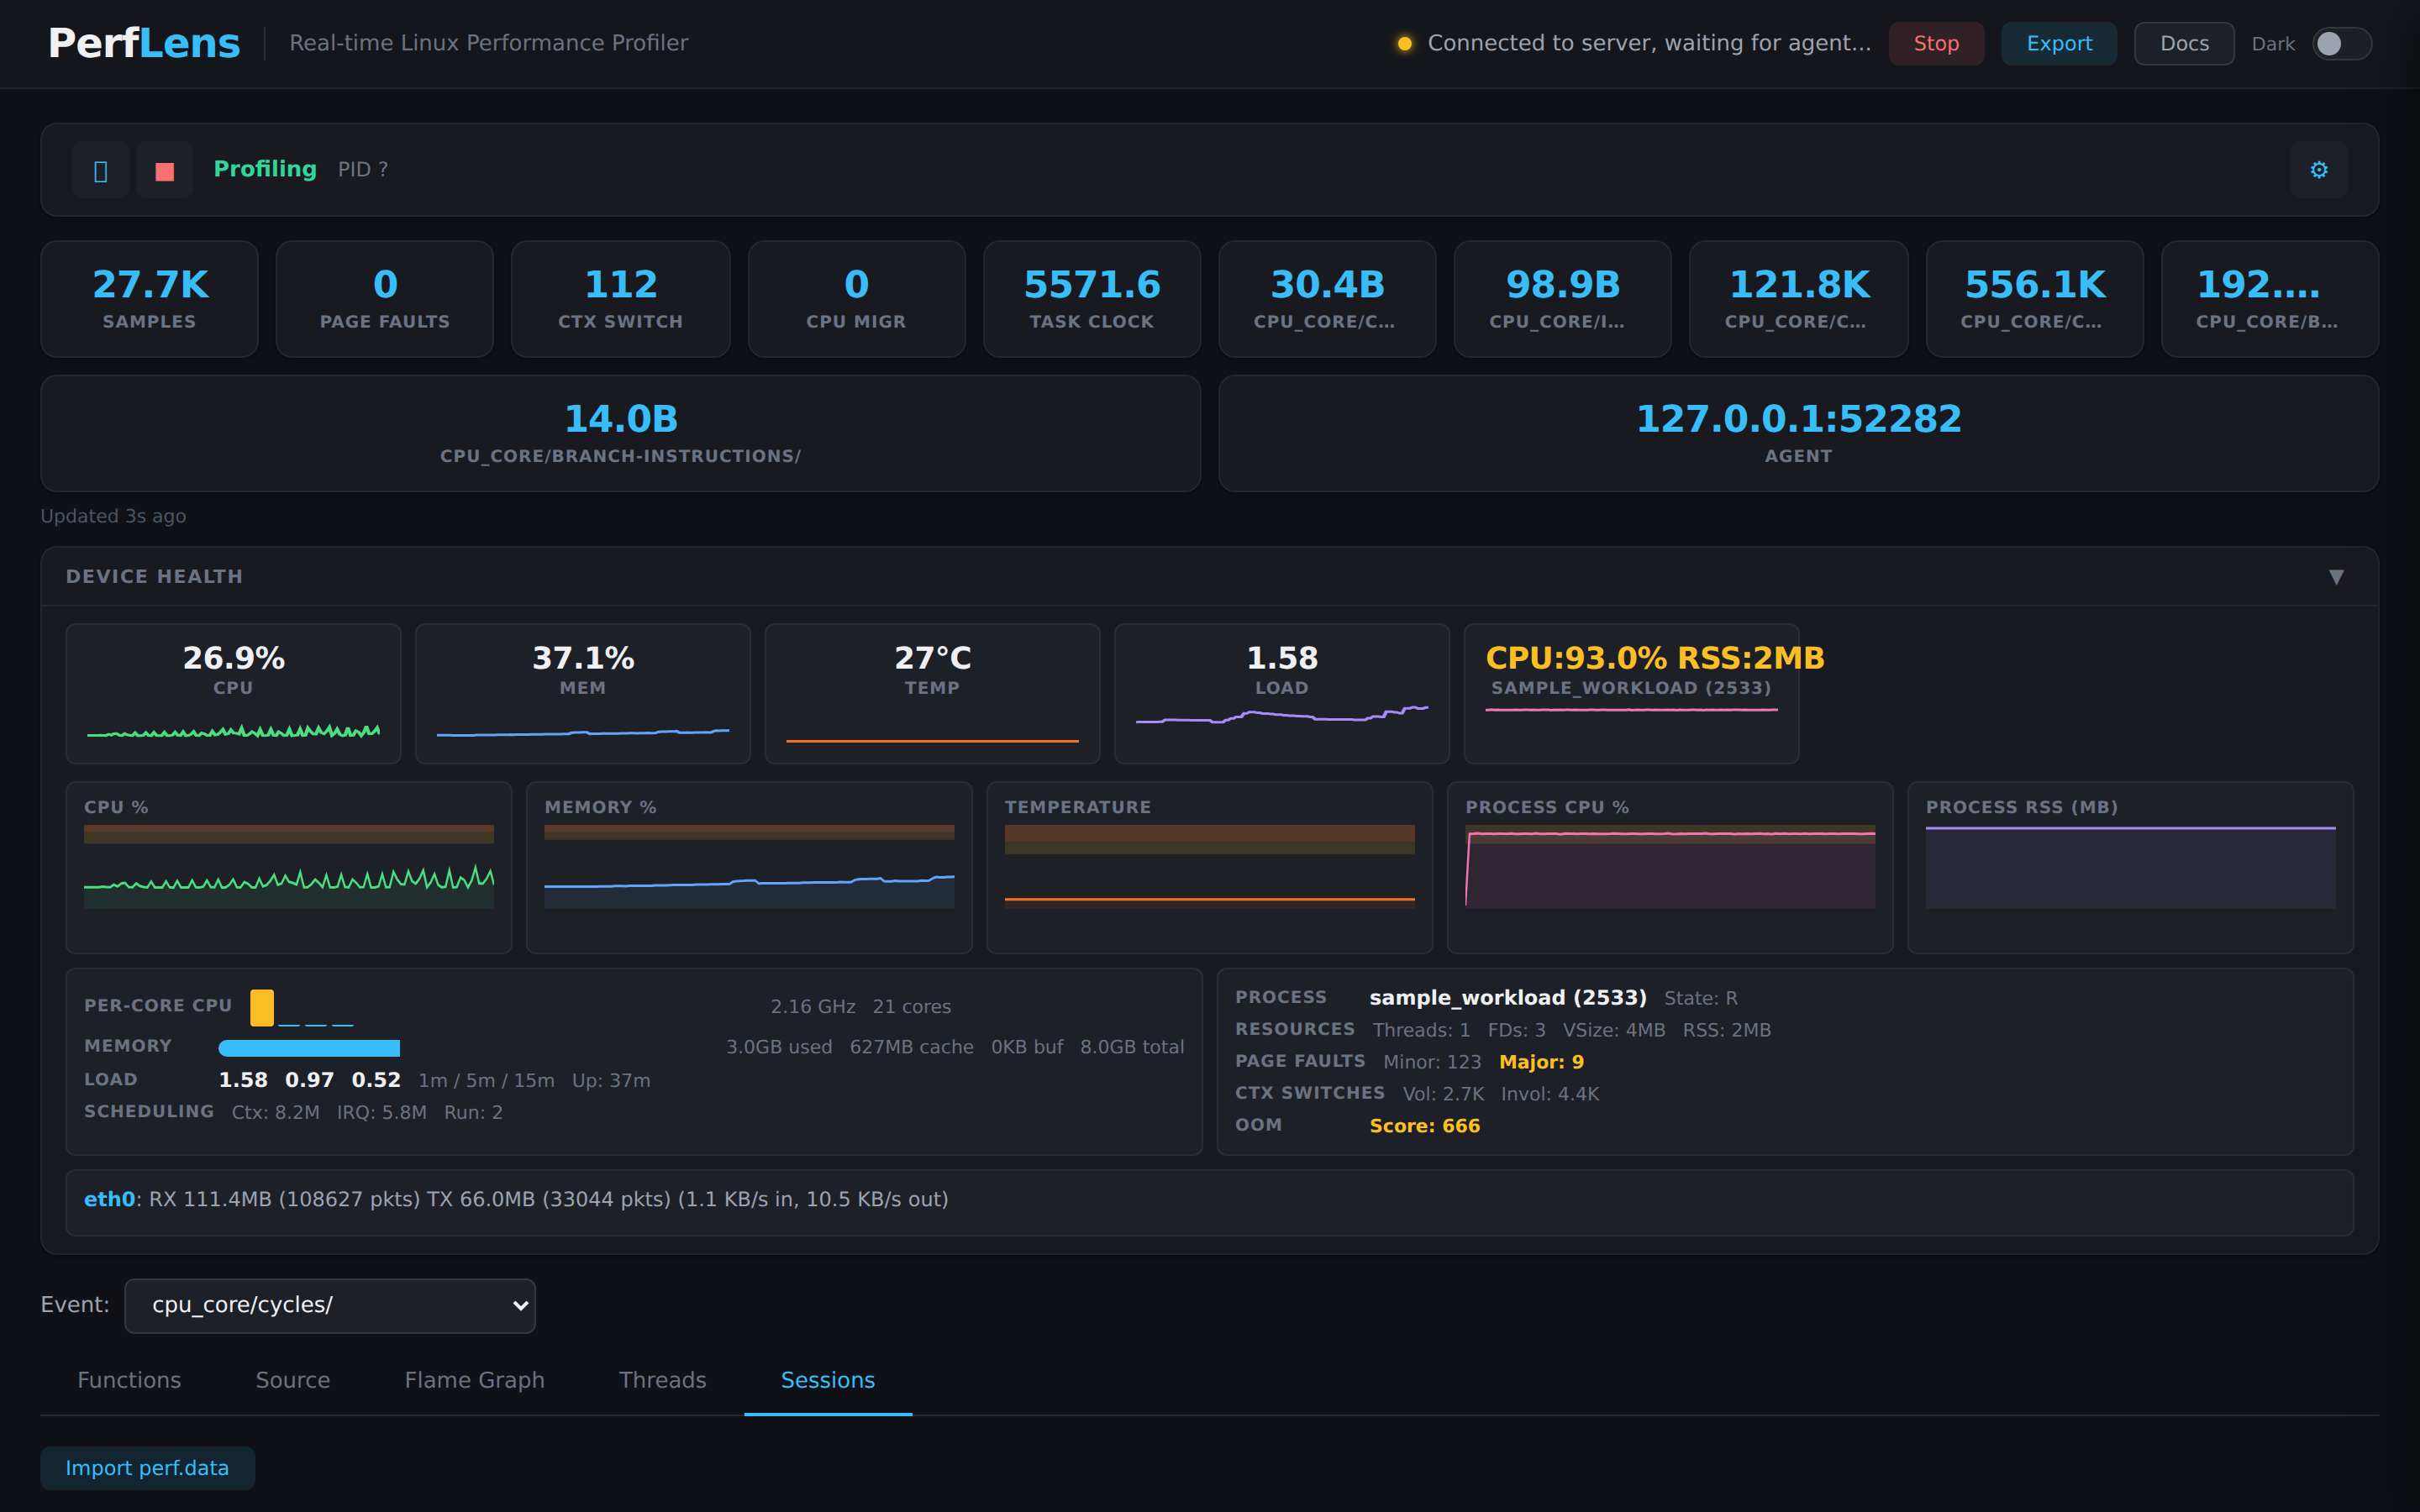
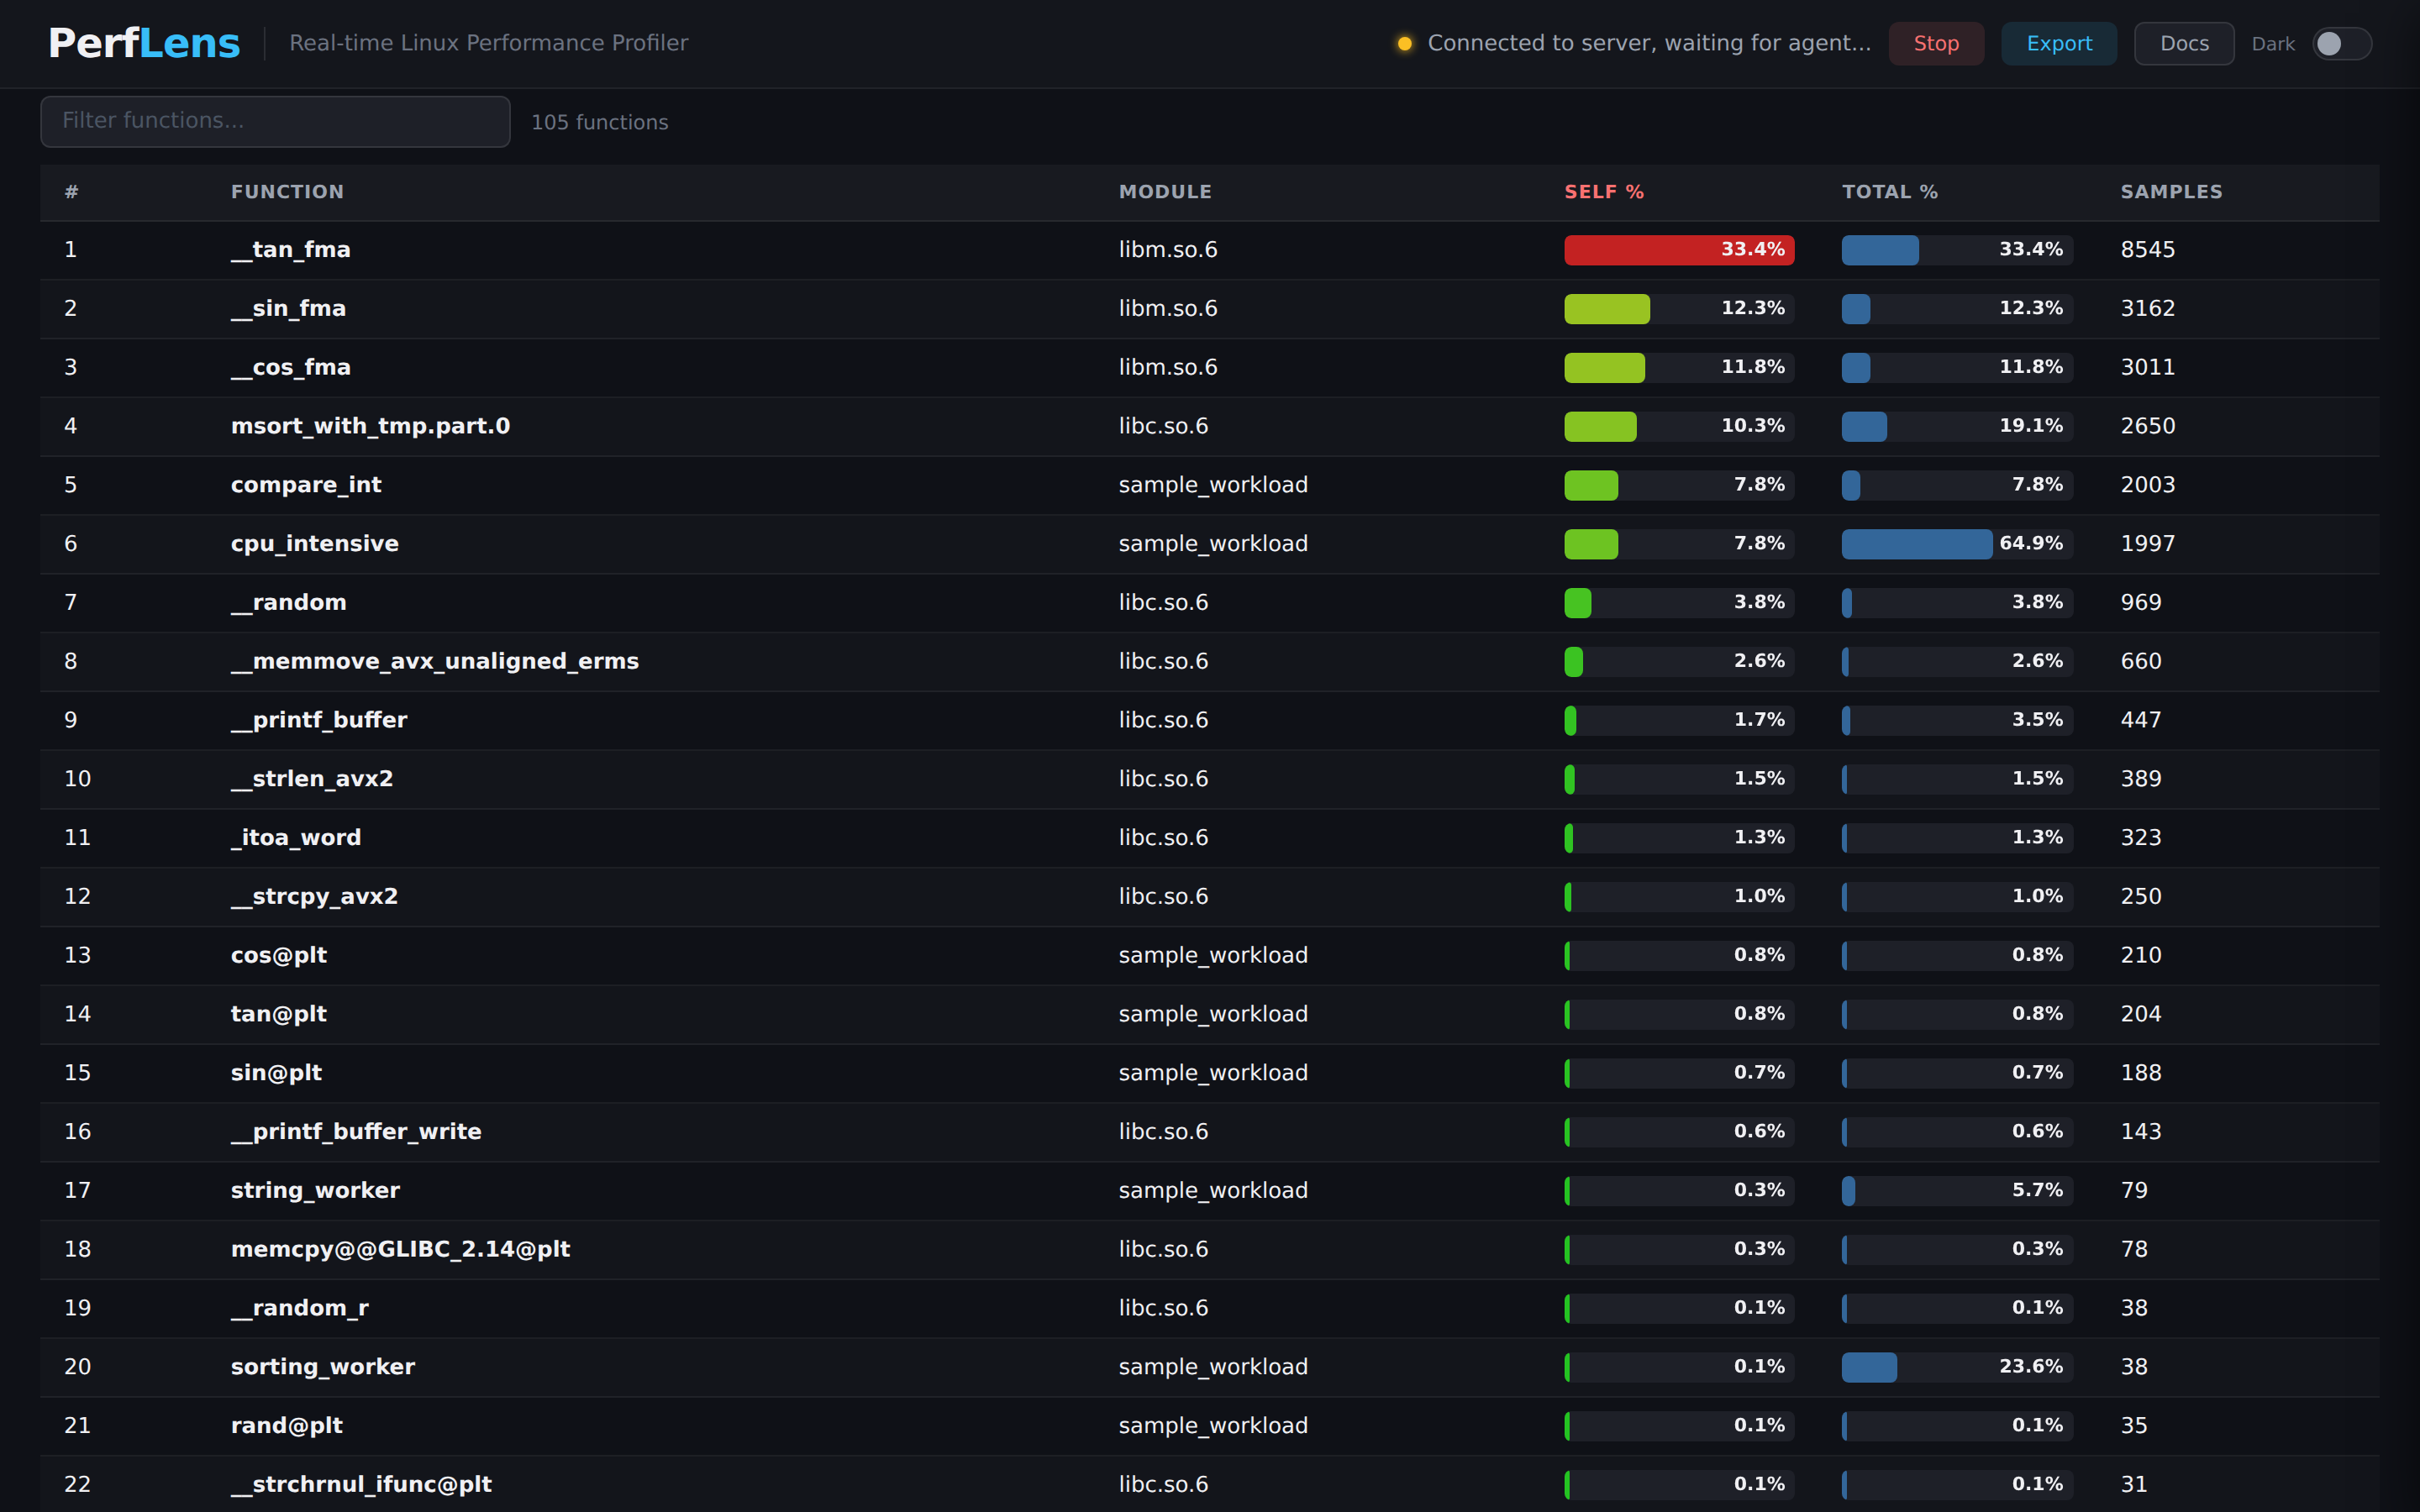
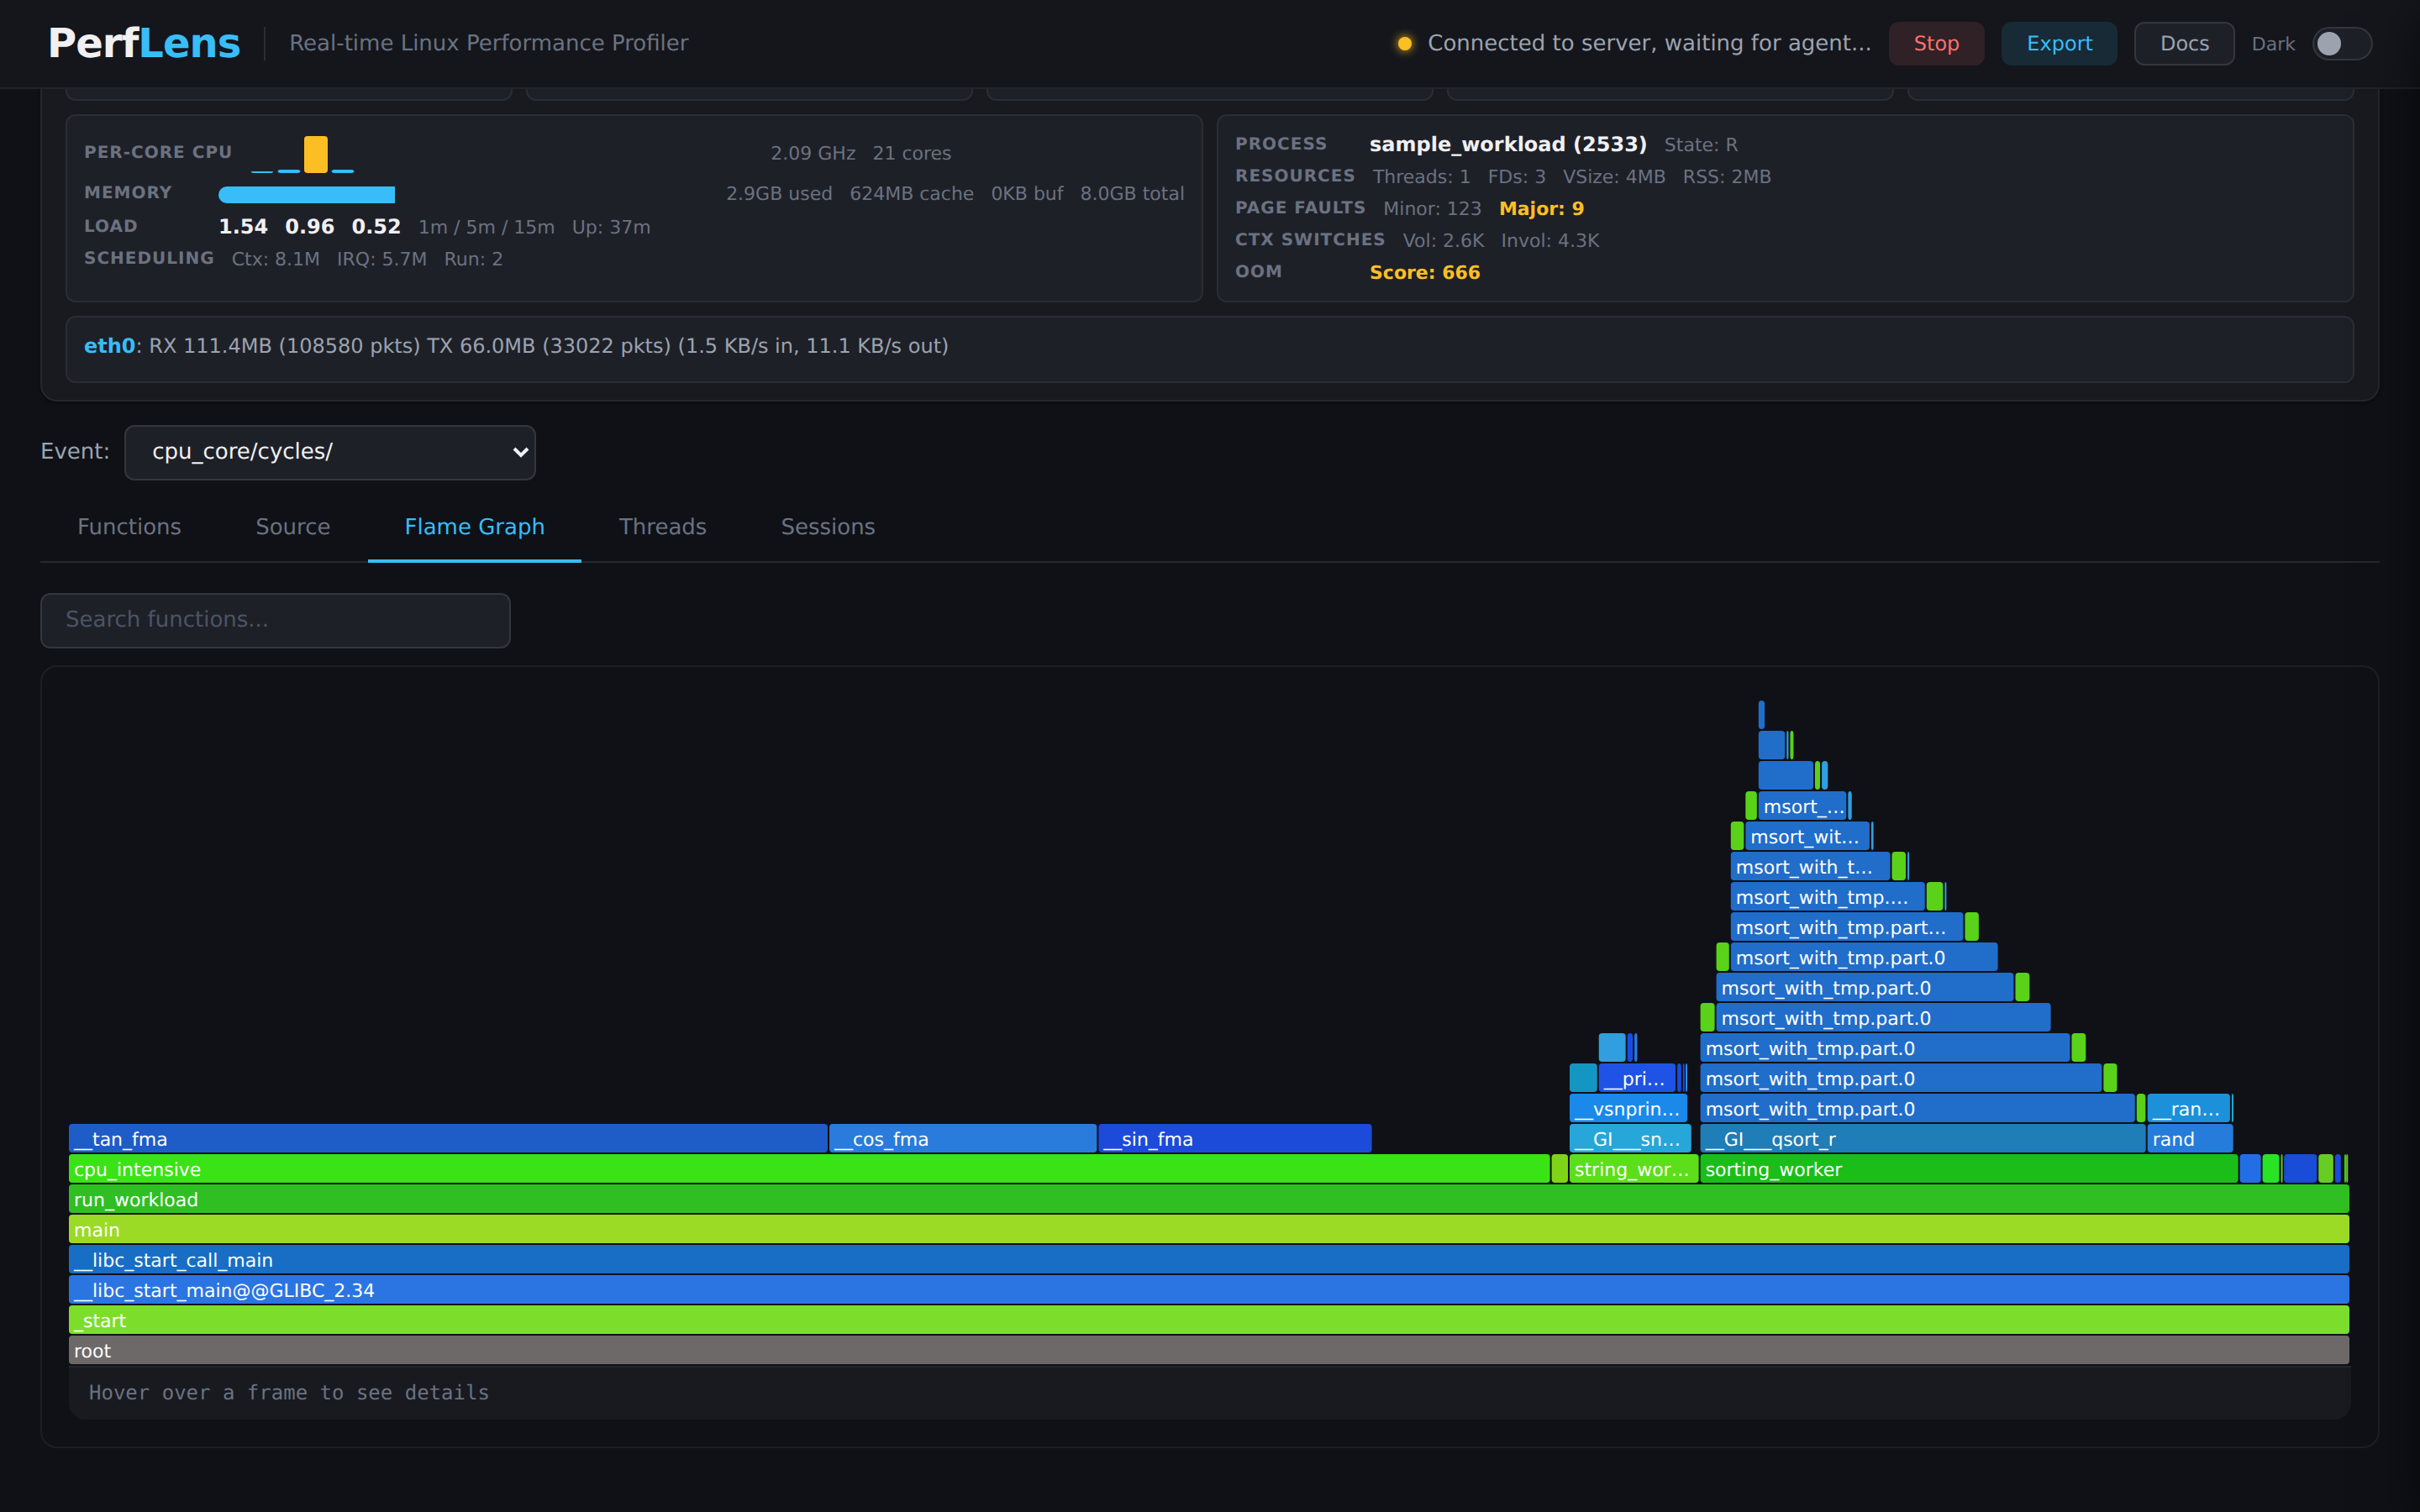
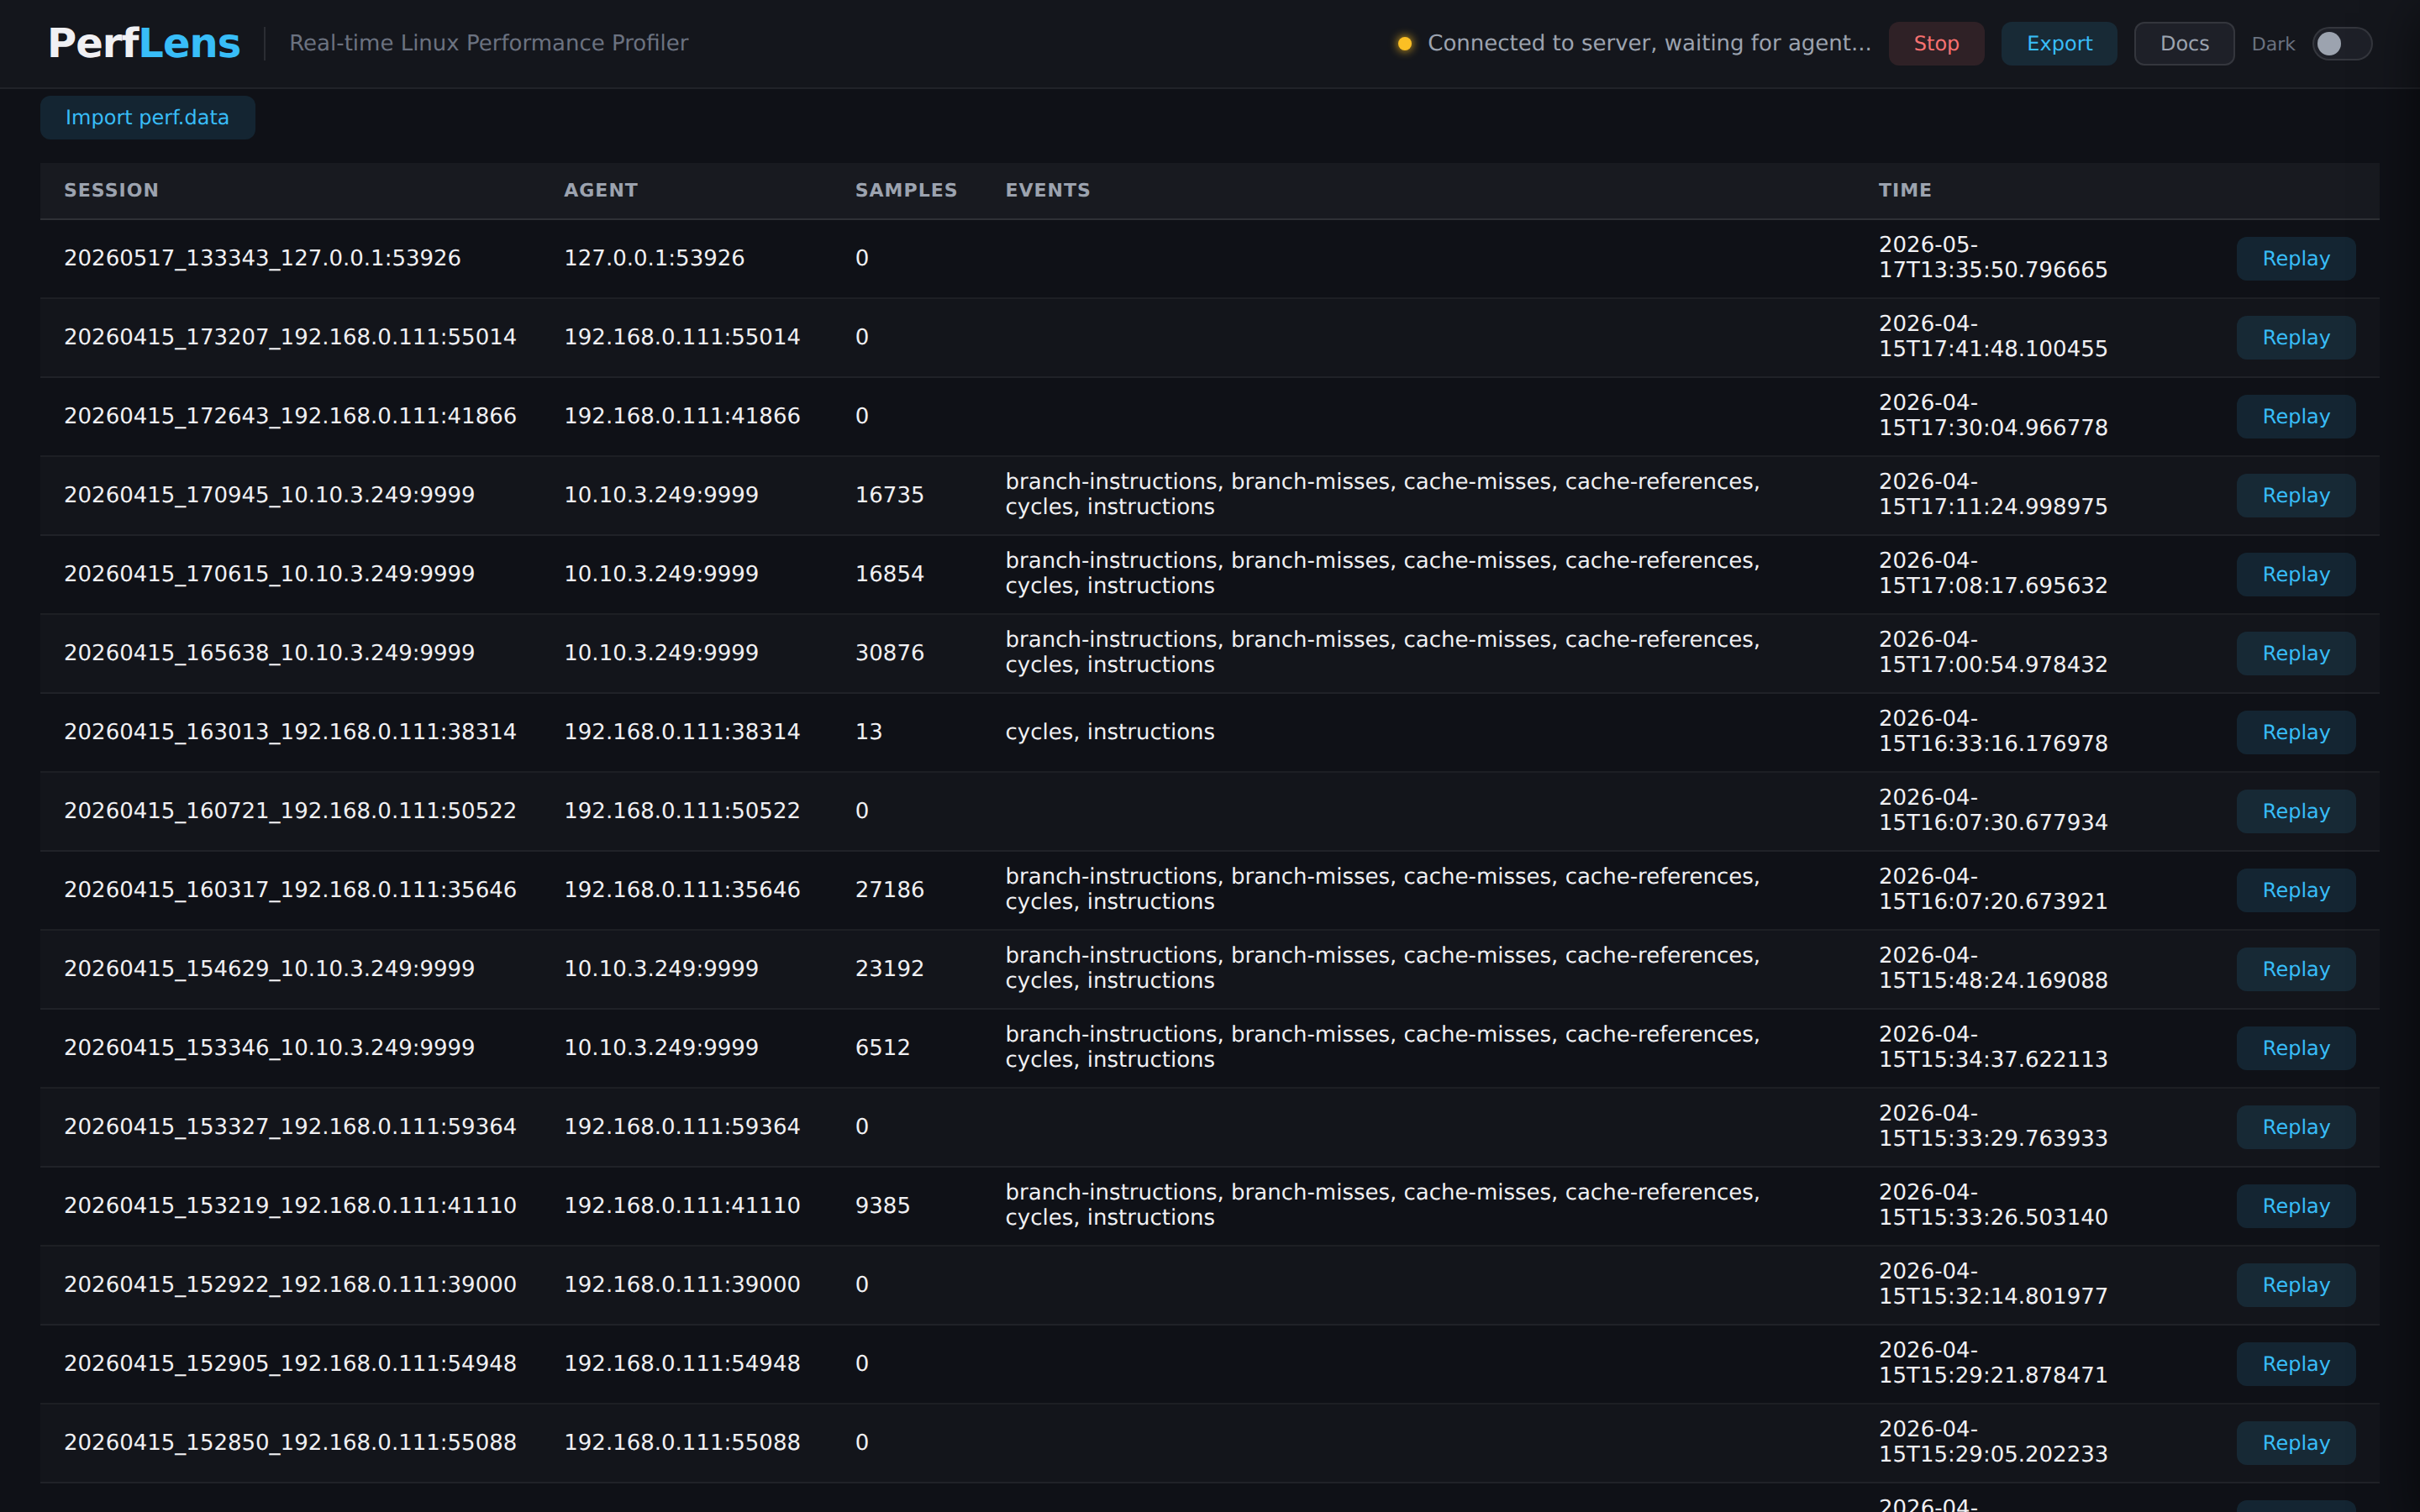
Drop a tiny agent on any Linux box, point it at a PID, and watch flame 
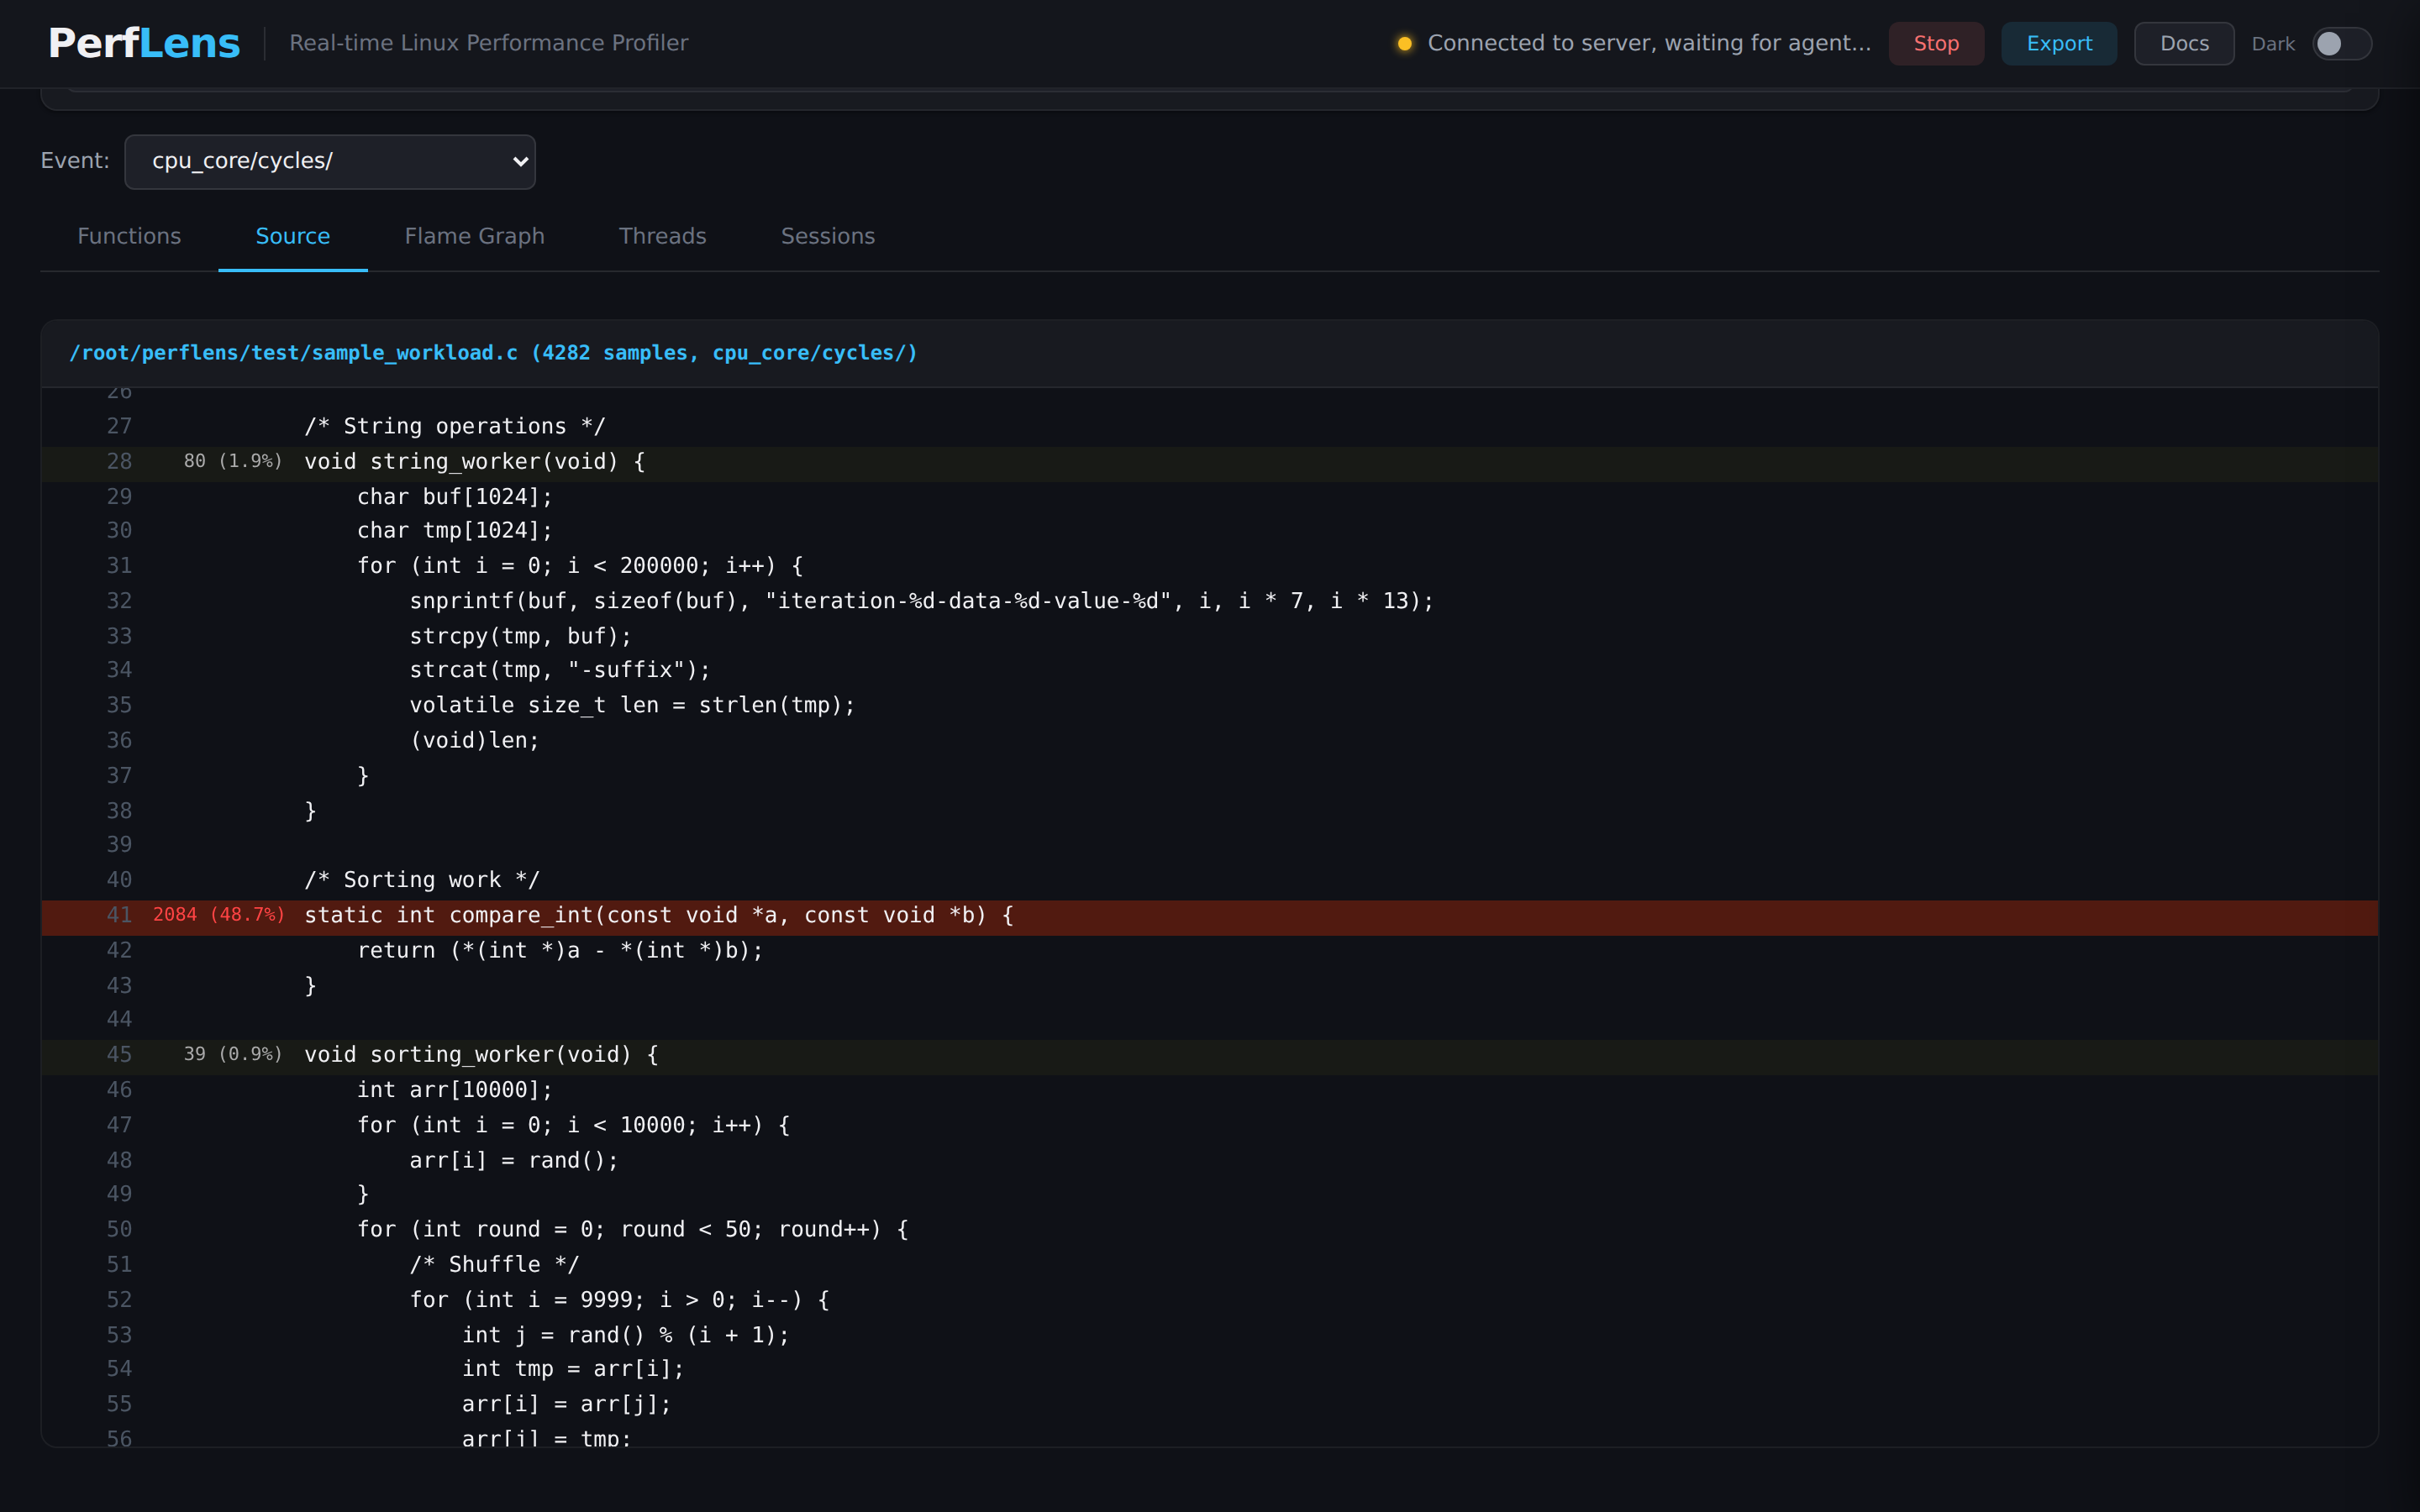
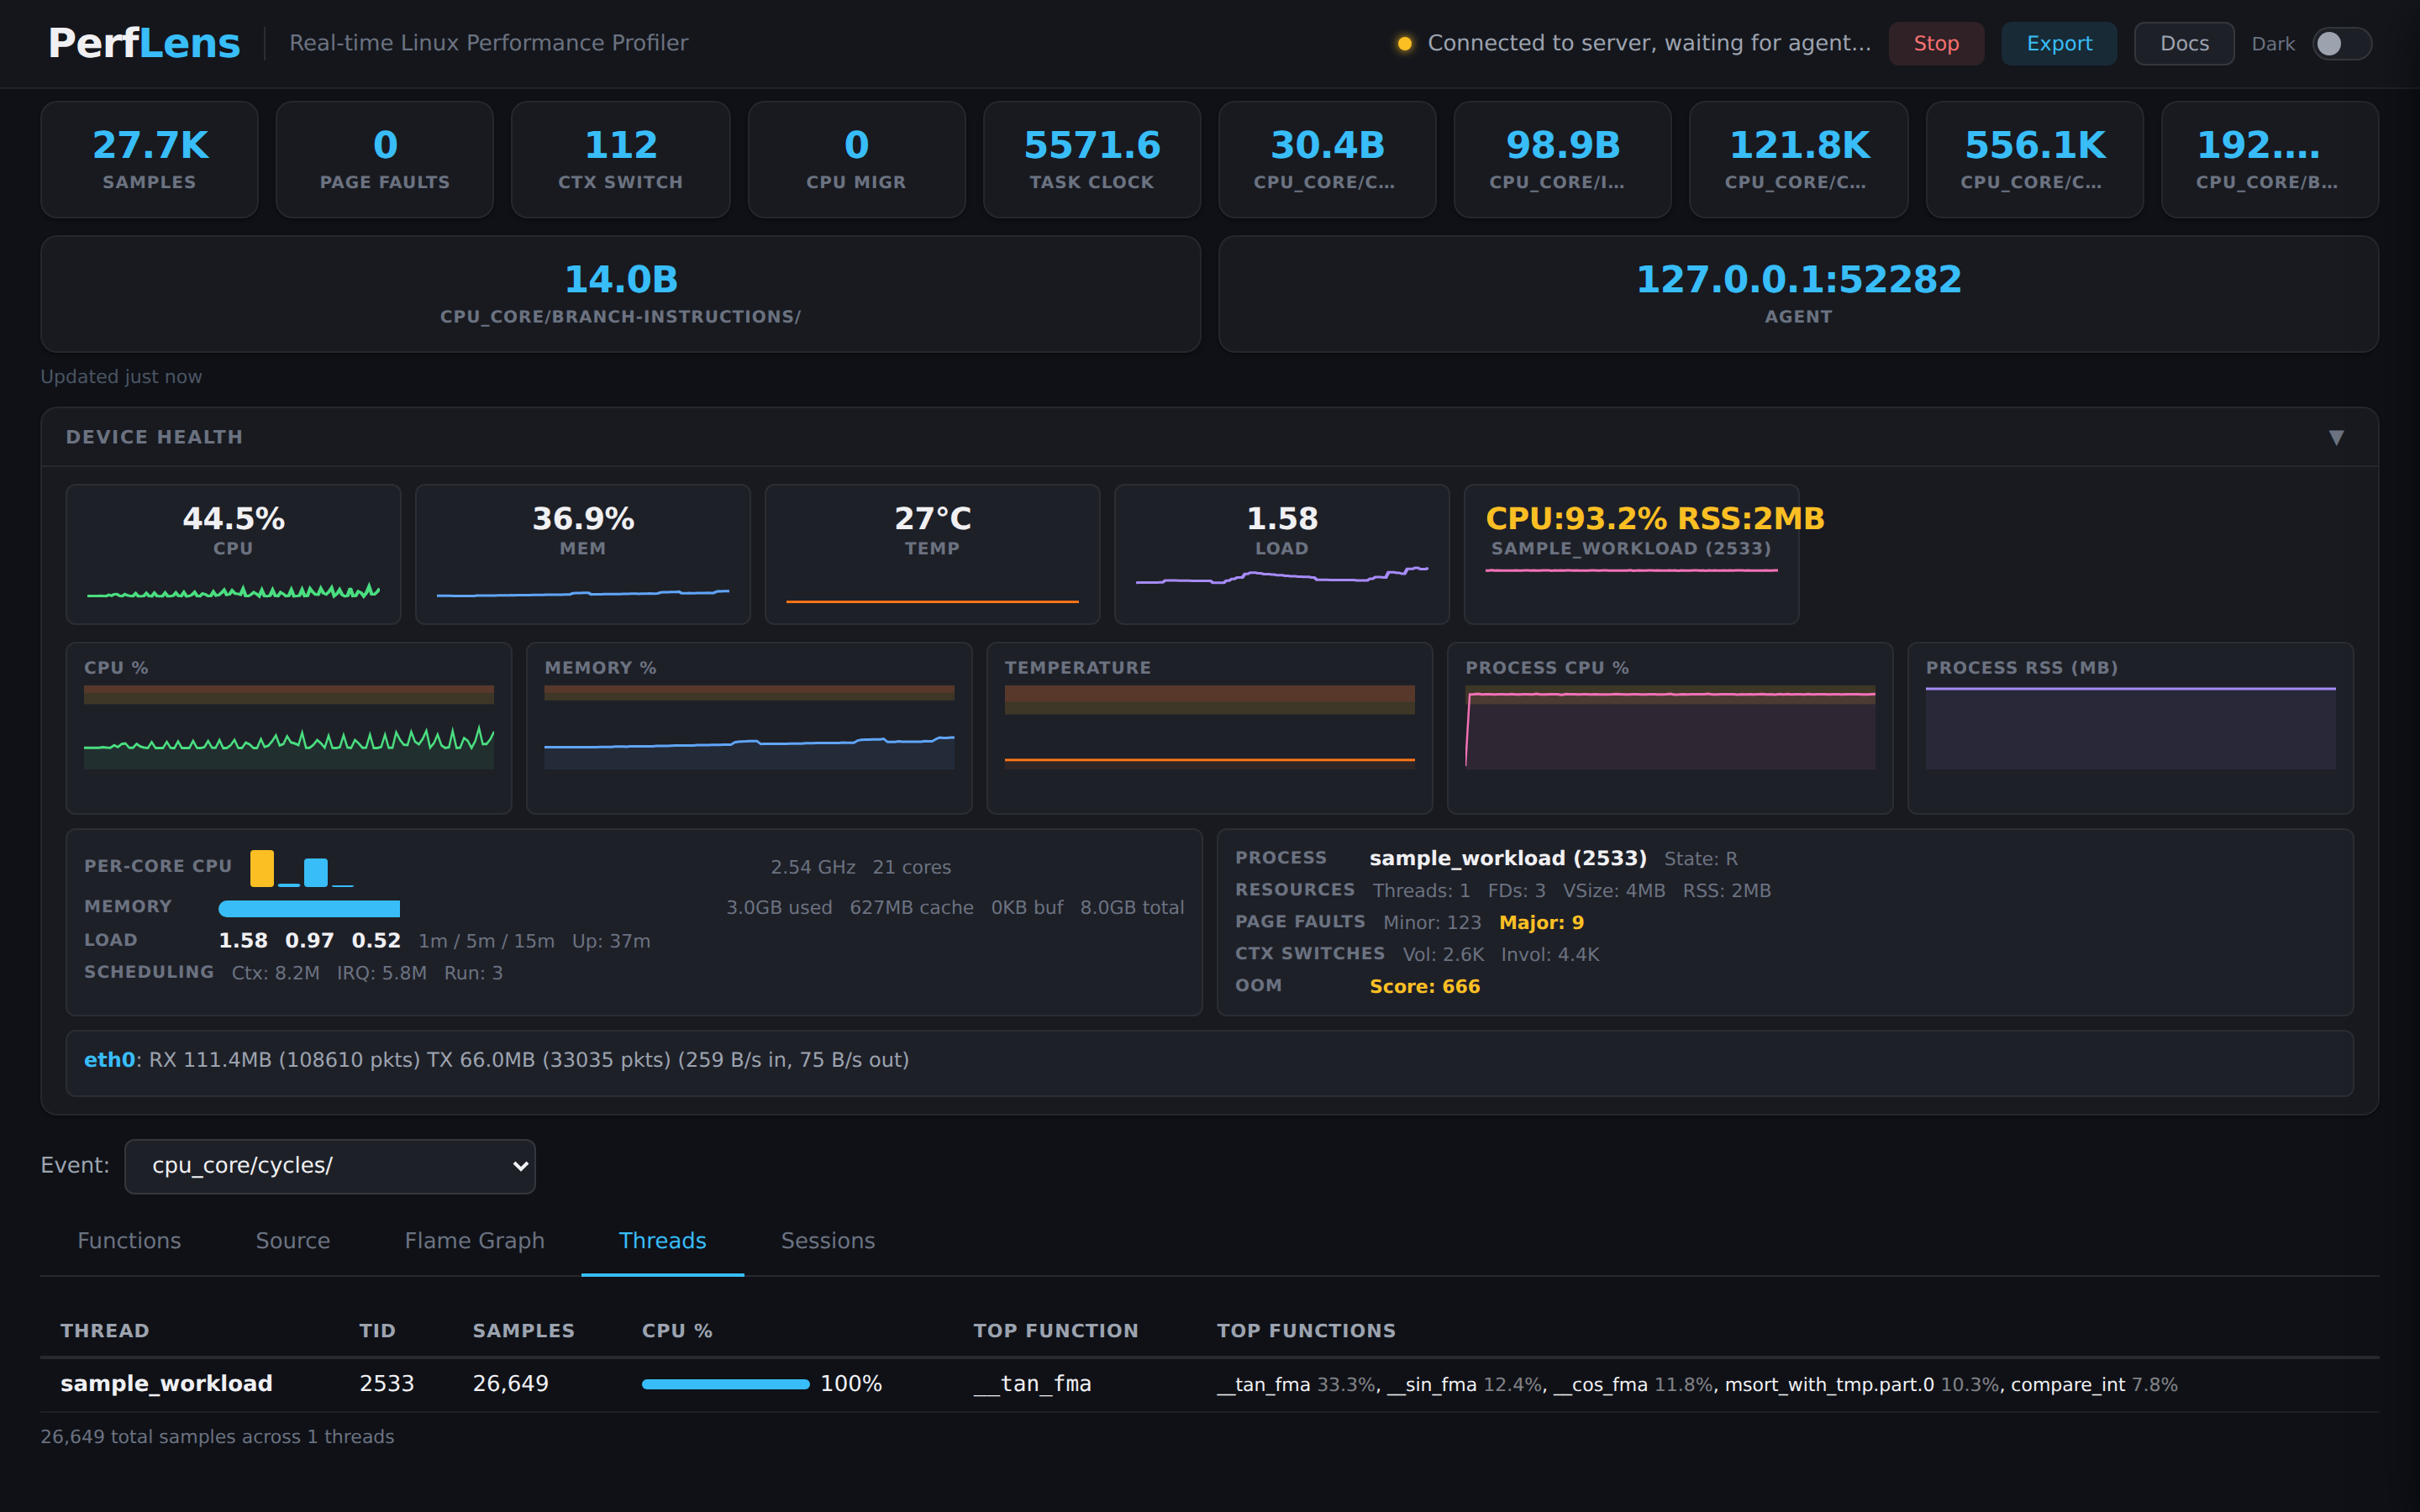
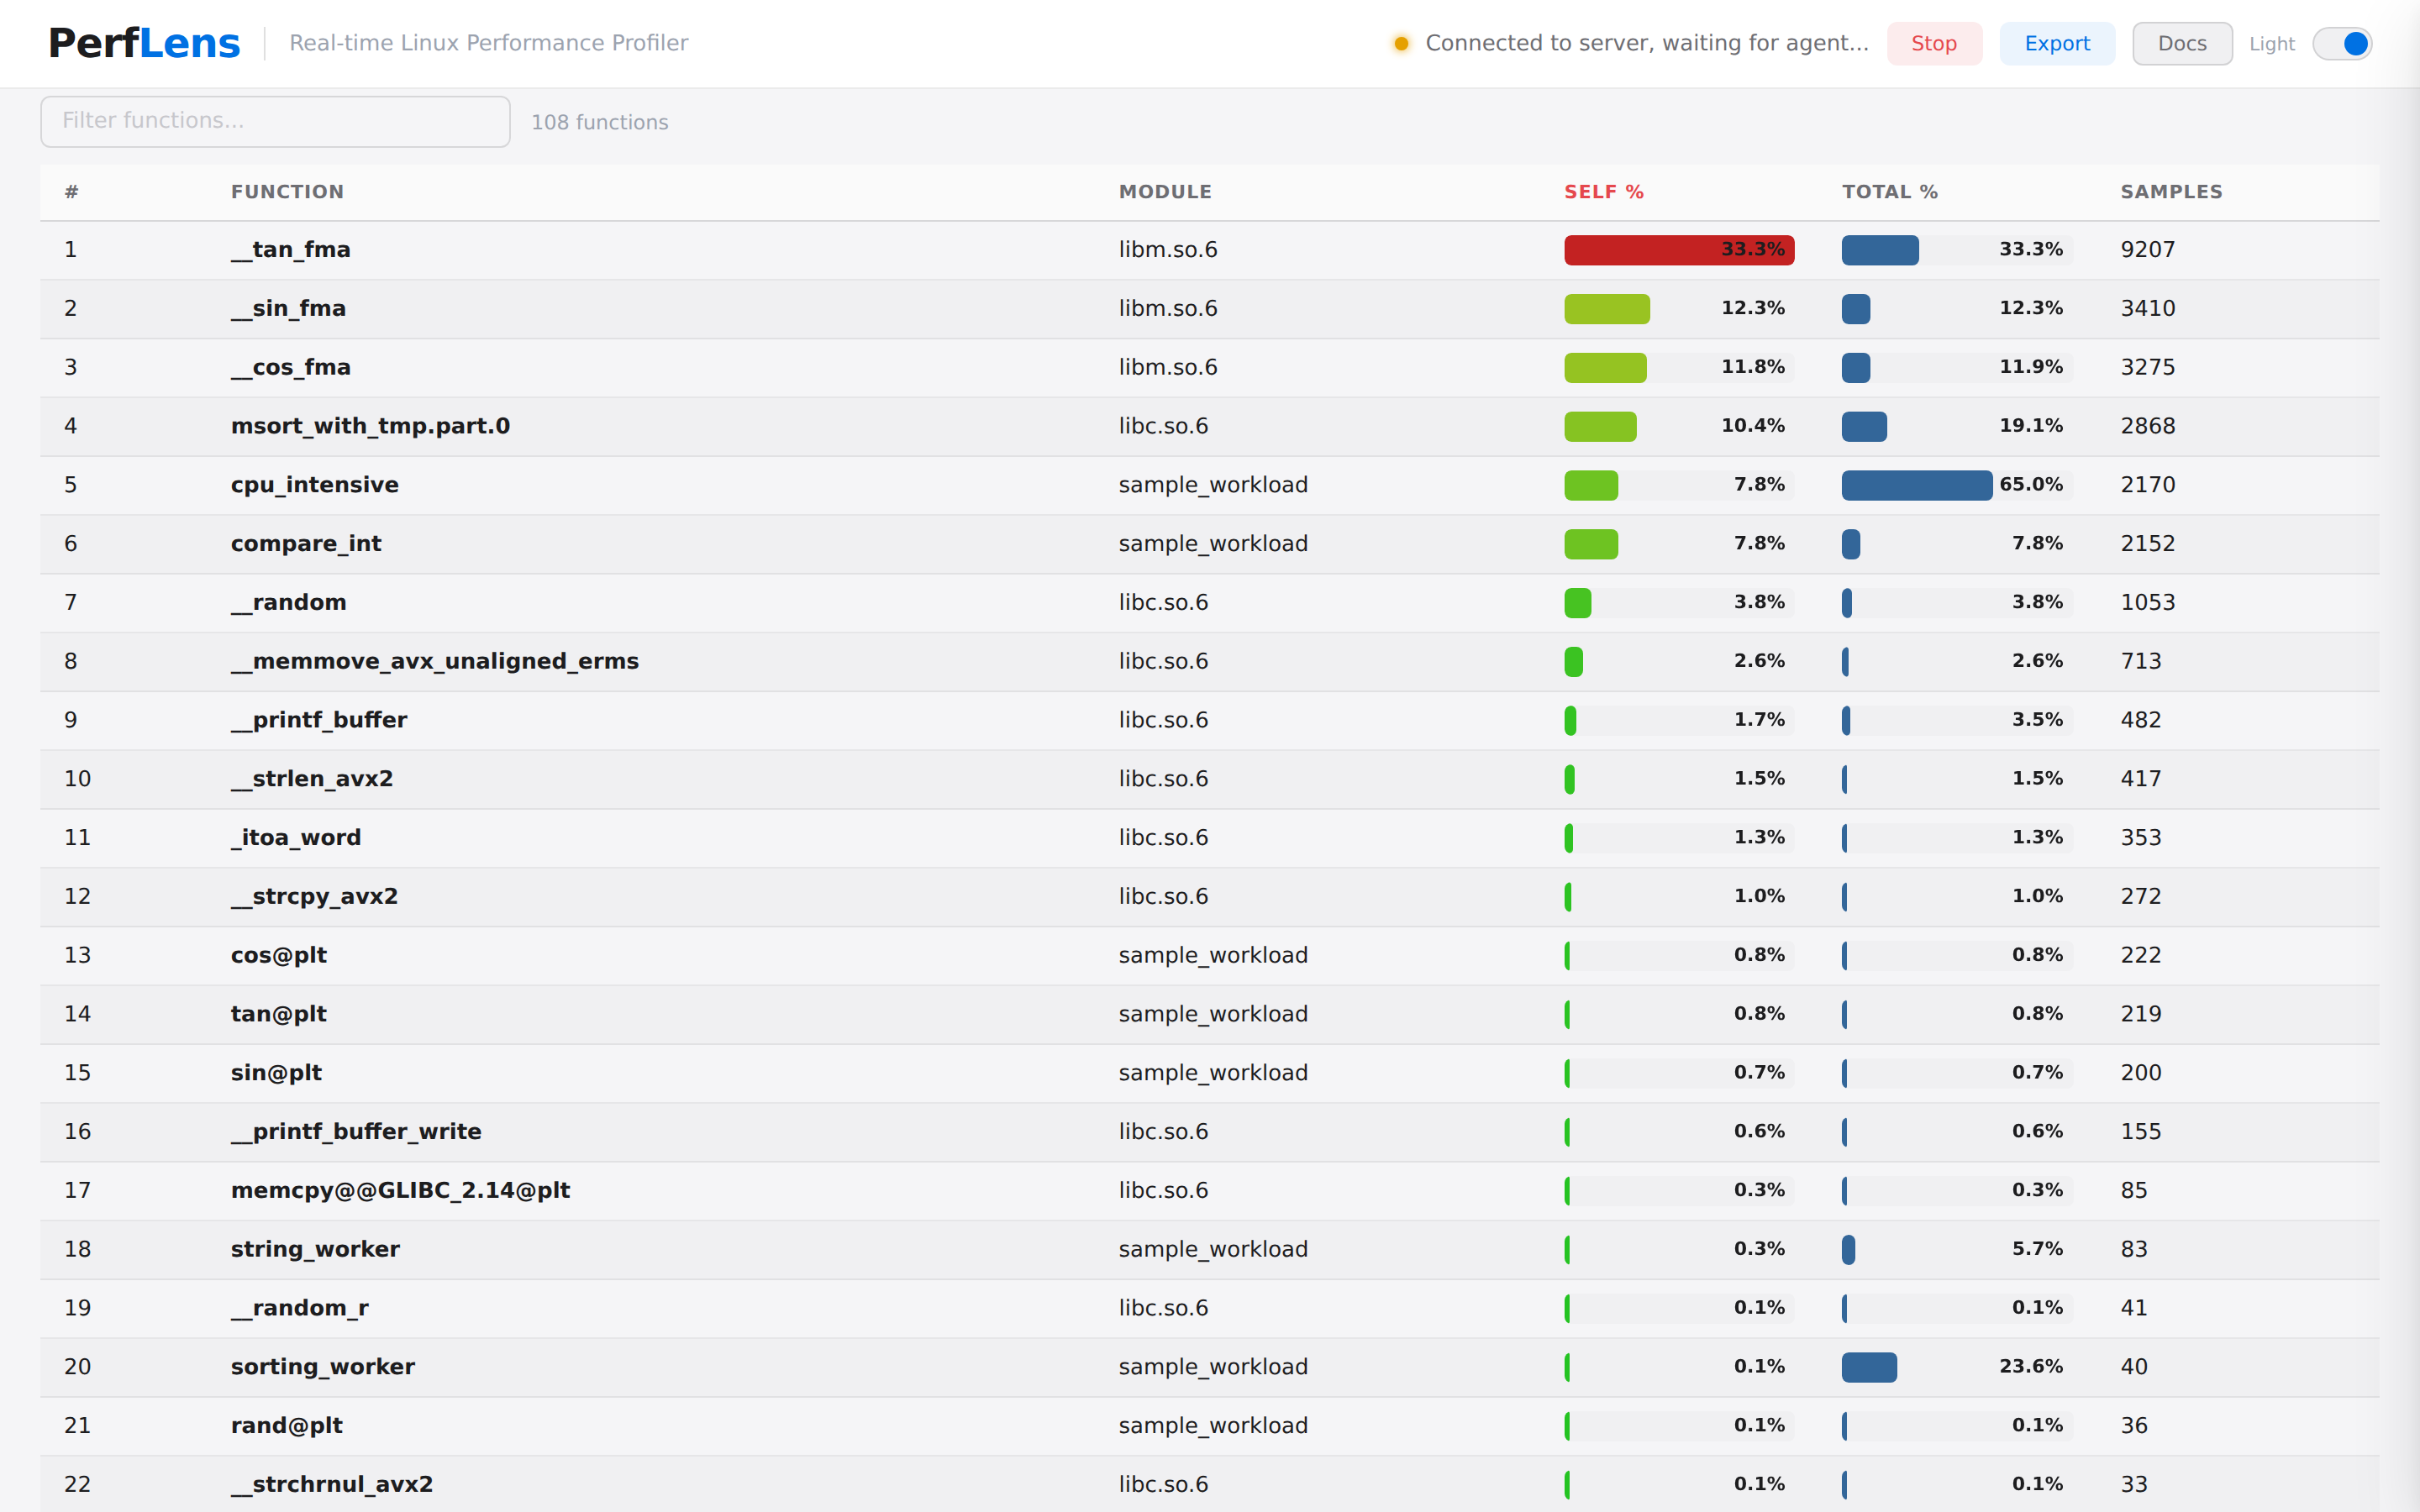
graphs, function tables, perf stat metrics, and line-level annotated source update live — no frameworks, no Docker, no pip dependencies.

license python arch wire deps
PerfLens overview: perf counters, device health, sparklines, and per-core CPU all updating live in the browser
Live demo: function table updating in real time, flame graph, then source view

Sample counts climb live as perf record rounds stream in. Flip to flame graph, click a function, land in source with line-level heat. Zero polling — Server-Sent Events.

What it does

One tool, the full perf pipeline.

Remote perf record, real-time SSE streaming, flame graphs, per-thread analysis, and source-level heat — without leaving the browser.

Real-time streaming

The agent runs perf record in 8-second rounds. Each round is zstd-compressed and pushed over TCP. Browser sees flame graphs update as new data arrives.

🔥

Interactive flame graphs

Vanilla-JS SVG flame graphs. Zoom into a frame, hover for sample counts, search by function name, breadcrumb back to root.

🔎

Line-level source heat

addr2line pipelined in batches of 500. Hot lines are heat-colored red/amber/green so you spot the cost without leaving the file.

🧑‍💻

Per-thread analysis

Filter flame graphs, function tables, and source annotations by thread. A dedicated Threads tab shows per-tid CPU breakdowns and top functions.

🛡

Two agent flavors

Python 3.5+ agent (~600 lines, stdlib only) for hosts with Python. Static C binary (~1.8 MB, vendored zstd) for bare-metal targets — both wire-protocol-identical.

🧮

Capability probing

Agent enumerates which perf events the kernel actually supports, tries call-graph modes (fpdwarflbr), and picks the first that produces non-empty stacks.

Cross-compile aware

One --toolchain-prefix derives addr2line and readelf. --sysroot resolves shared libraries and source files under a target tree, like perf --symfs.

💾

Save & replay

Every session is saved as raw chunks on disk. Replay any past session lazily through the UI — or import a perf.data file directly with --import.

🔅

Two connect modes

--server: agent dials out to the server (reconnects with backoff). --listen: agent waits, server connects in through the UI's Live Debug wizard.

Tour

What you actually see.

Every screenshot below is captured from the real UI — a live profile of a multi-threaded test workload, sampled at 199 Hz, replayed straight from the server.

Function table sorted by self-percent
Function table Self %, total %, sample counts, module column, live filter.
Interactive SVG flame graph
Flame graph Zoom, hover, search. Vanilla SVG — no d3, no bundling.
Annotated source with line-level heat map
Source heat map Lines colored by sample share. Hot line jumps out red.
Per-thread CPU breakdown and top functions
Per-thread breakdown Each tid with sample count, CPU share, and its top functions.
Saved sessions list
Saved sessions Replay anything you've captured before, or import perf.data.
Function table in light theme
Light theme Dark or light — one click. CSS custom properties, no rebuild.
Quick start

Profiling in under a minute.

Pre-built tarballs are published on every tagged release. Pick the install flavor and follow three steps.

1

Install the server on the machine where you view profiles

Pre-built tarballs are available for Linux x86_64, macOS arm64, and Windows x86_64.

tar xf perflens-server-<ver>-linux-x86_64.tar.gz
./perflens-server-<ver>/perflens-server \
    --source-dir /path/to/sources \
    --binary     /path/to/unstripped-binary
# UI: http://localhost:8080
2

Drop the agent on the Linux target

The Python agent is one file; runs on Python 3.5+. Two connect modes are supported.

# Agent dials out to the server (with reconnect/backoff)
./perflens-agent --server <server-ip>

# Or — agent listens, you connect from the UI's Live Debug wizard
./perflens-agent --listen
3

Open the UI and start the wizard

Browse to http://<server-ip>:8080. With --server the UI switches as soon as the agent connects; with --listen, click Live Debug and point at the agent.

1

Build the static binary

Zero runtime dependencies; vendored zstd; cross-compiles from a single Makefile.

cd agent-c
make                                    # native x86_64
make CROSS=aarch64-linux-gnu-           # ARM64 little-endian
make CROSS=aarch64_be-linux-musl-       # ARM64 big-endian
make CROSS=arm-linux-gnueabihf-         # ARMv7 little-endian
make CROSS=armeb-linux-musleabihf-      # ARMv7 big-endian
2

Ship the single file

The output is one ~1.8 MB binary. No libc surprises, no Python needed.

scp perflens-agent user@device:/tmp/
ssh user@device /tmp/perflens-agent --server <server-ip>
3

Open the UI

The C agent and Python agent speak the same wire protocol — the server can't tell them apart.

1

Clone & run the server

git clone https://github.com/harshithsunku/perflens.git
cd perflens
python3 server/perflens_server.py \
    --source-dir /path/to/source \
    --binary     /path/to/myprogram \
    --port       9999 \
    --http-port  8080
2

Copy the agent to the target and run

scp agent/perflens_agent.py user@device:/tmp/
ssh user@device python3 /tmp/perflens_agent.py --server <server-ip>
3

Open http://<server-ip>:8080

That's it. The UI auto-switches into the profiling view when samples start flowing.

Prerequisites. Target needs Linux + perf; local needs Python 3.8+ (or the frozen tarball), addr2line, and readelf (bundled or on PATH). For source-level annotation, your binary must be compiled with -g and not stripped.
Pipeline

How a sample travels.

perf record on the target. The agent flattens the trace with perf script, compresses with zstd, frames with a 5-byte header, and pushes over TCP. The server decompresses, parses per-event sample lists, builds flame graph trees, pipes addresses through addr2line in batches, and broadcasts the result to every connected browser via Server-Sent Events.

Typical zstd ratio on real perf script output: 20–40×.

Read the architecture →
PerfLens architecture diagram
Design rules

Built to a short list.

Stdlib only

No Flask, no npm, no Docker. ThreadingHTTPServer on the server. Plain HTML + vanilla JS + CSS on the UI.

Defensive parsing

perf script format drifts across kernel versions. The parser handles 2.6 through 6.x output with optional [cpu], pid/tid, and flags fields.

No over-engineering

If a piece of code doesn't earn its complexity, it gets cut. No frameworks for the sake of frameworks.

Generic & open

MIT-licensed. No proprietary names, IPs, credentials, or company-specific anything in code, docs, or history.