callsight adds entry/exit timing hooks to a C or C++ project at compile
time, with zero edits to its sources. One trace.config decides
which files, folders, or call subtrees get hooks — and everything you exclude emits
no hook at all, so it costs exactly zero at runtime.
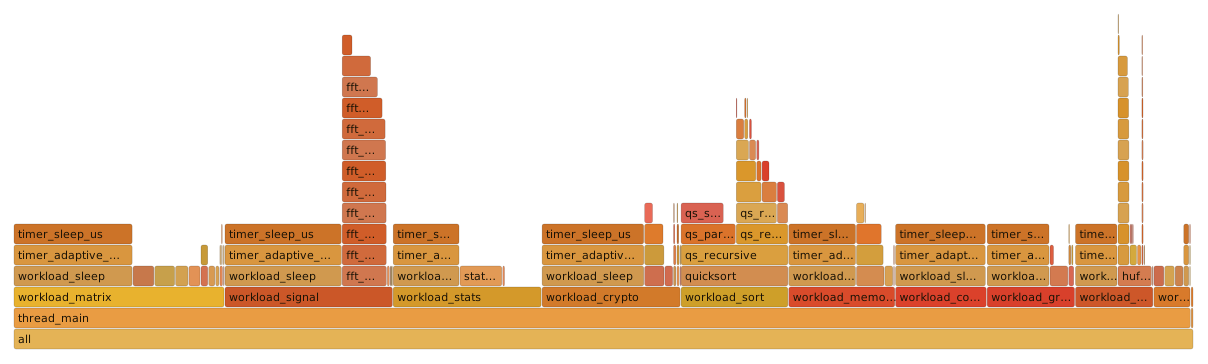
A real trace of the bundled matrixlab workload — 1,000,000 events across
26 threads, exported with callsight analyze --format folded and rendered
as a flame graph.
Compile-time selection, a lock-free per-thread runtime, exact per-call timing, and a report you can read in the terminal, in a browser, or in a flame graph.
Hardware counters give exact instructions retired per function. Across five runs
of one binary the count did not move while wall time swung five-fold — which is what
makes diff --key instructions_per_call a
gate you can set at 1%.
32-bit and big-endian agents are first class: the device writes its native byte order and the host adapts. ARMv7, PowerPC32 and s390x are cross-built, run under qemu and analyzed on x86 in CI on every push.
Hooks come from -finstrument-functions at compile time. Your source
tree is never touched — adopting callsight adds a config file and a build include,
nothing else.
Excluded code is not compiled with hooks, so it does not check a flag, take a branch, or touch a buffer. Runtime filters can't match that — the instruction simply isn't there.
Every call is counted and timed, so p50, p99 and max are measurements rather than estimates — the rare slow call a sampling profiler would miss entirely is right there in the table.
folded for flamegraph.pl and speedscope, chrome for a
real timeline in Perfetto, callers for hot call sites, and
json plus callsight diff to fail a build on a
regression.
Capture is bounded by default, rotates in segments, stops before the filesystem
does — and says so in the report. TRACE_MODE=summary aggregates
in-process instead: hours of execution, kilobytes of output, exact counts.
On a constrained target the runtime writes into a shared-memory ring; a tiny C client ships it ZSTD-compressed over TCP. The traced process does no disk or network I/O, and a full ring drops events rather than stalling your workload.
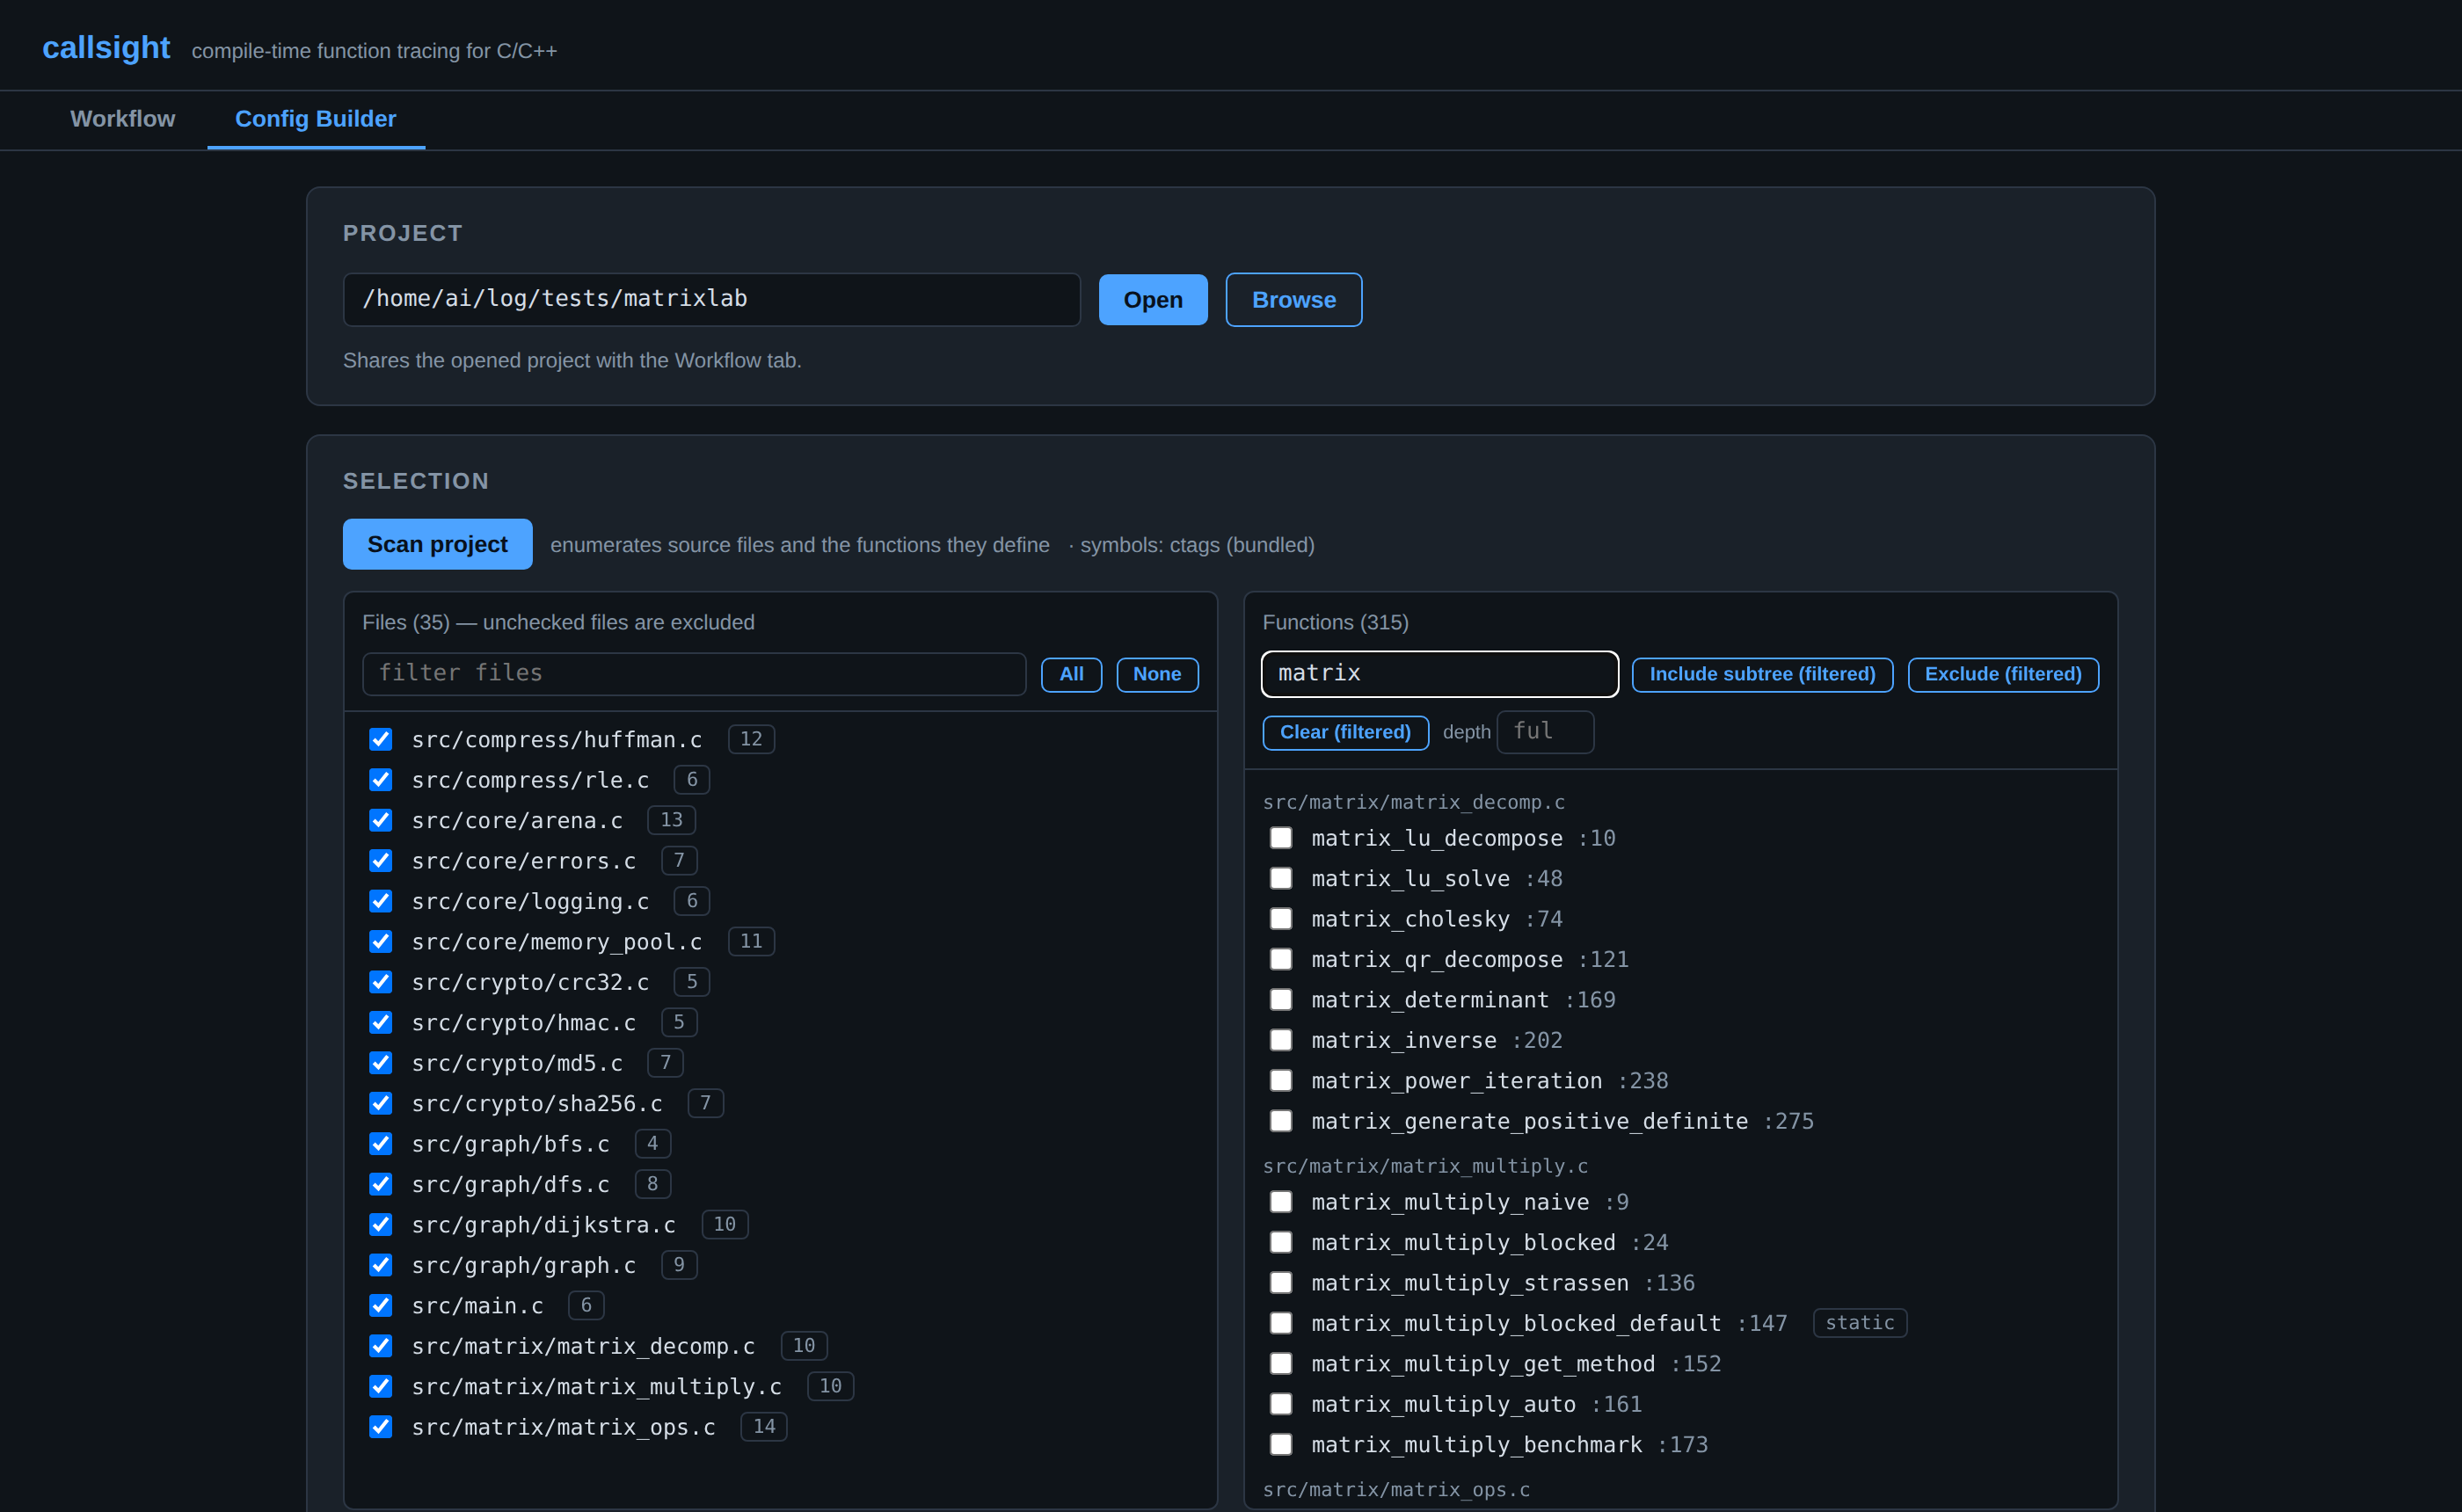
callsight ui walks the whole loop — browse a project, build the
config from checkboxes, compile, run, and read the hotspot table. No root, one
command.
Four stages. The only one that touches your build is the first, and it is driven
entirely by trace.config.
callsight flags turns trace.config plus your source
list into -finstrument-functions and the matching exclude lists. The
Make and CMake integrations call it for you on every build.
The compiler emits __cyg_profile_func_enter/exit calls. The runtime
appends 32-byte events to a thread-local buffer — no locks, no malloc, no I/O on
the hot path — and stays inert unless TRACE_ENABLE=1.
Buffers flush to trace.<pid>.<tid>.bin, or into a POSIX
shared-memory ring that the trace_stream client drains and forwards to
callsight serve on your workstation.
callsight analyze streams the events, matches enter/exit per thread,
resolves addresses through addr2line — static functions
included — and prints, exports, or serves the report.
The streaming path (cyan) is optional — without it, buffers flush straight to trace files next to your binary.
A call-heavy program generates millions of events per second. Every tracer has to answer "how do I record less?" — callsight answers it in the compiler, before a single instruction is emitted.
# trace.config
include src/network/ # only this subsystem
exclude src/network/crc.c # except the chatty helper
exclude-func log_printf # and this one, by name
# or select one task's whole call subtree:
include-func handle_request # + everything it calls
include-func resolves the call graph statically from your sources,
so naming one entry point selects exactly its subtree — explore it first with
callsight select src/ --function handle_request.
$ callsight scan . --config trace.config
35 sources: 34 instrumented, 1 excluded
excluded: src/utils/rng.c
$ callsight select src/ --function workload_sort
workload_sort: 31 functions across 6 files
heapsort
mergesort
qs_partition
…
# add to trace.config:
include-func workload_sort
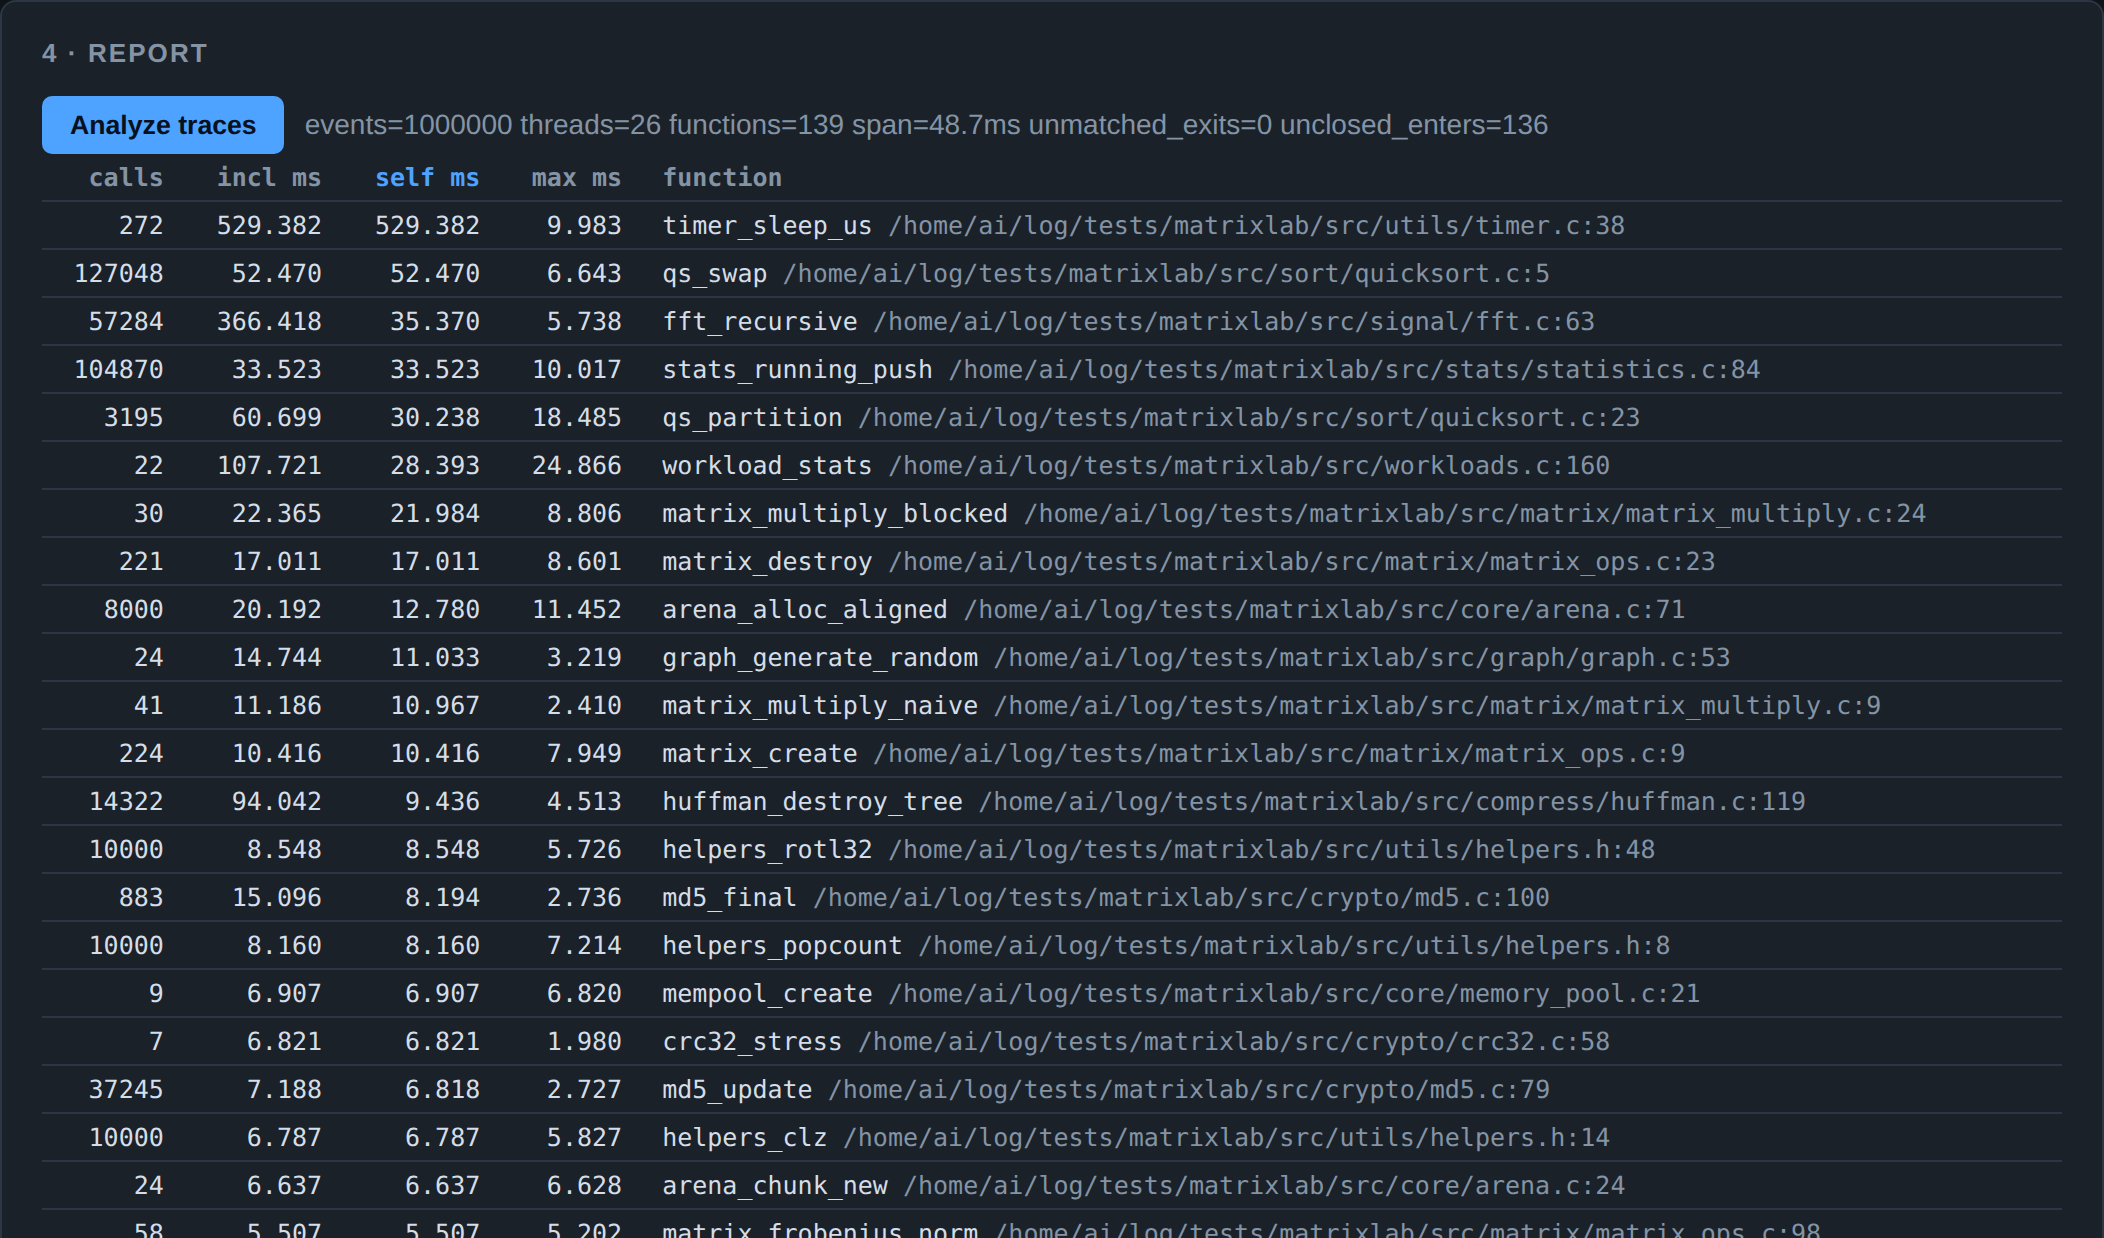
Sort by self time for hot leaves, by inclusive time
for the slow high-level operation, by calls to find your next
exclusion. unmatched_exits=0 means the trace is clean.
$ callsight analyze traces/ --exe bin/matrixlab.instr --top 5
events=850059 threads=24 functions=84 span=6.6ms unmatched_exits=0 unclosed_enters=127
== TOP BY SELF TIME ==
calls incl_ms self_ms p50 p99 max function (first location)
12 13.170 13.170 983.04us 1.97ms 1.97ms timer_sleep_us (src/utils/timer.c:38)
16111 11.098 6.518 71ns 3.84us 1.59ms qs_partition (src/sort/quicksort.c:23)
358383 4.738 4.738 8ns 14ns 352.74us qs_swap (src/sort/quicksort.c:5)
4 2.335 2.230 180.22us 1.70ms 1.79ms matrix_multiply_blocked (src/matrix/matrix_multiply.c:24)
384 1.450 1.450 4.61us 5.63us 7.75us matrix_lu_solve (src/matrix/matrix_decomp.c:48)
qs_swap normally finishes in 8 ns and once took 352 µs. A mean
hides both numbers; a sampling profiler would almost certainly never see that call.
trace.config.Adopt an existing project without changing a line of its code.
Stdlib-only Python core; the extras are optional.
$ uv tool install callsight # or 'callsight[ui]' for the web UI
Copies the hook runtime and the build wiring, writes a starter
trace.config, and prints the snippet for your build system.
$ cd /path/to/your/project
$ callsight init .
The instrumented profile is separate from your normal build, and stays inert
until you ask for a trace. callsight run traces it and reports in
one step.
$ make instrument
$ callsight run -- ./bin/yourapp.instr
$ cmake -DCALLSIGHT_INSTRUMENT=ON -B build-instr
$ cmake --build build-instr
$ callsight run -- ./build-instr/yourapp
Terminal tables, a flame graph, a Perfetto timeline, or JSON for your own tooling.
$ callsight analyze traces/ --exe ./bin/yourapp.instr --top 20
$ callsight analyze traces/ --exe ./bin/yourapp.instr --format folded > out.folded
$ callsight analyze traces/ --exe ./bin/yourapp.instr --format chrome > trace.json
Reach for perf first when you want a cheap statistical profile of a
whole system, or kernel and off-CPU time. Reach for callsight when you need
exactness for code you chose — every call counted, true tail latency per
function, exact instruction counts where you ask for them, and zero cost for
everything you did not choose.
| Tool | Granularity | Selection | Needs |
|---|---|---|---|
| callsight | Every entry/exit, exact timing | Compile time, from one config file — excluded code emits no hook at all | Rebuild with GCC |
| uftrace | Same mechanism, richer live TUI and replay | Mostly runtime filters (-F/-N), so filtered functions still pay for the hook |
Rebuild (-pg / -finstrument-functions) |
perf record |
Sampled, statistical | None needed | No rebuild; often root or perf_event_paranoid |
gprof (-pg) |
Sampled + call counts | None | Rebuild; single-threaded accounting |
| Clang XRay | Entry/exit with runtime patching | Per-function attributes and lists | Rebuild, Clang only |
-finstrument-functions-exclude-* flags it builds on are GCC-only
(LLVM #15627).
Clang can instrument everything — a config with no include/exclude
directives — and callsight detects the toolchain and tells you up front instead of
letting the build fail one file at a time.
Two commands to adopt, and nothing in your source tree changes.