Workflow tab
The end-to-end pipeline in four numbered steps, driving exactly the same code as the CLI.
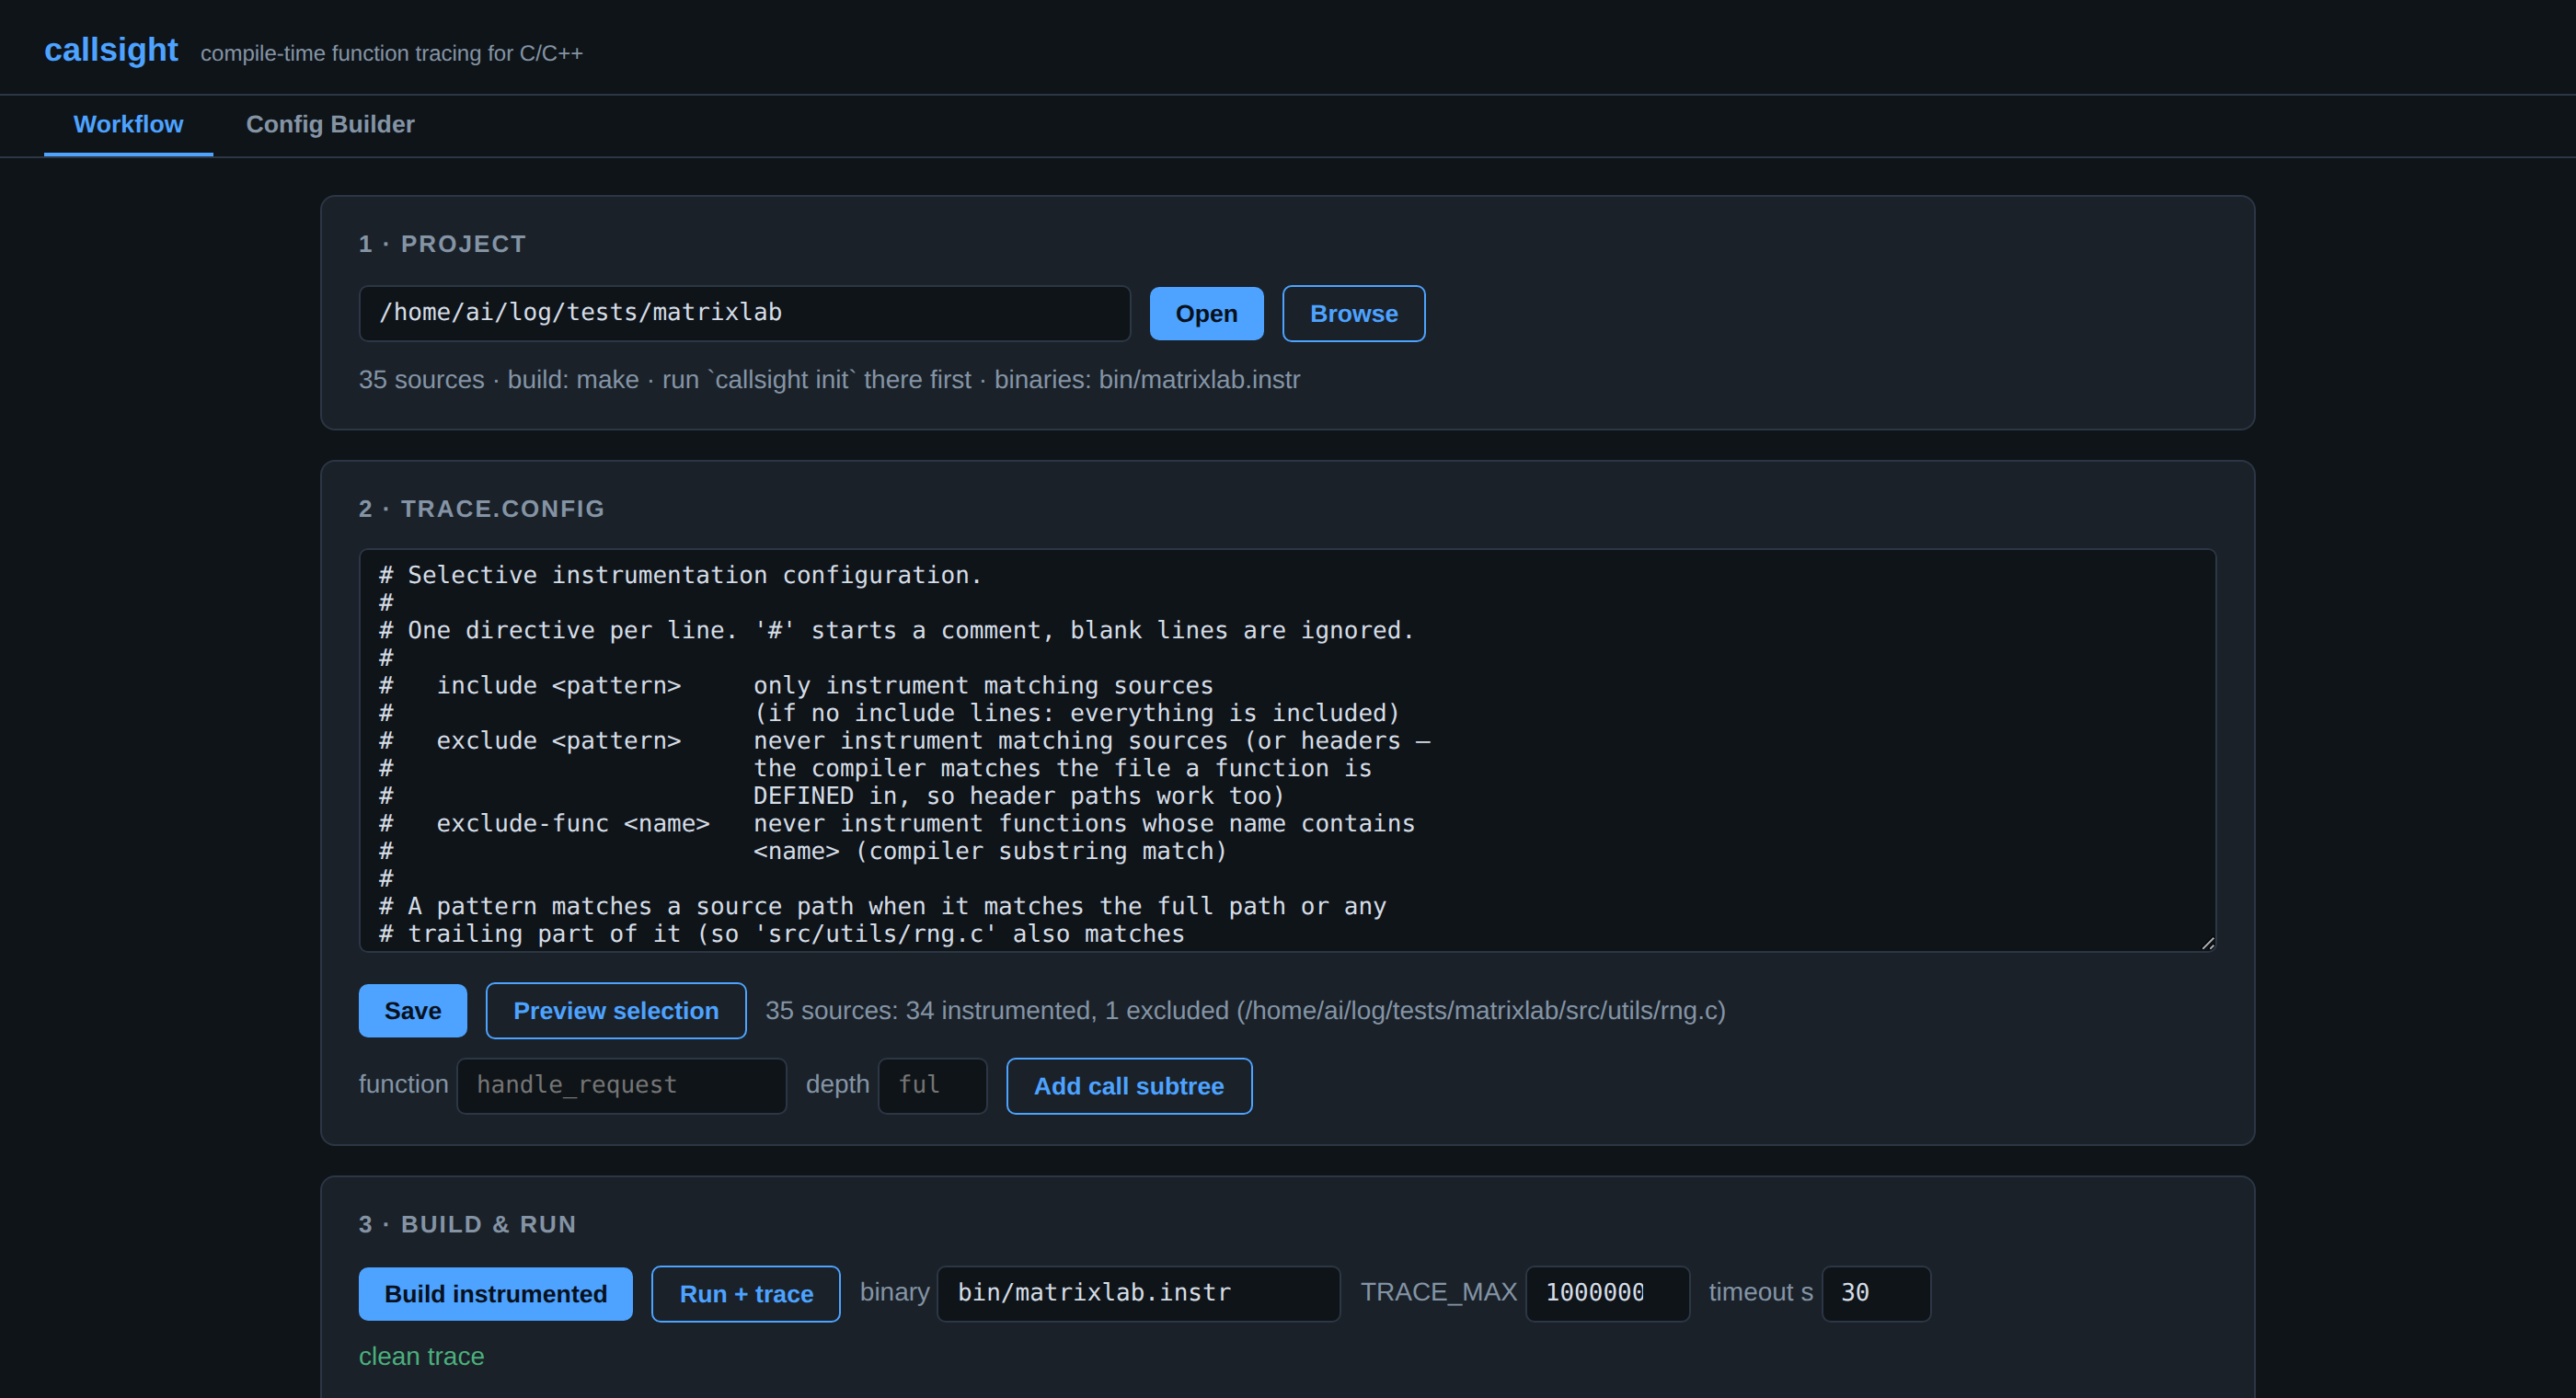
- Project — browse the filesystem (directories badged
make/cmake) and open one. You get the source count, the detected build system, and any instrumented binaries already present. - trace.config — an editor with save, a selection preview
(N sources: X instrumented, Y excluded), and a call-subtree helper: type a
function name and optional depth to resolve its subtree through the static call graph
and append the matching
include-funcline. - Build & run — one-click instrumented build
(
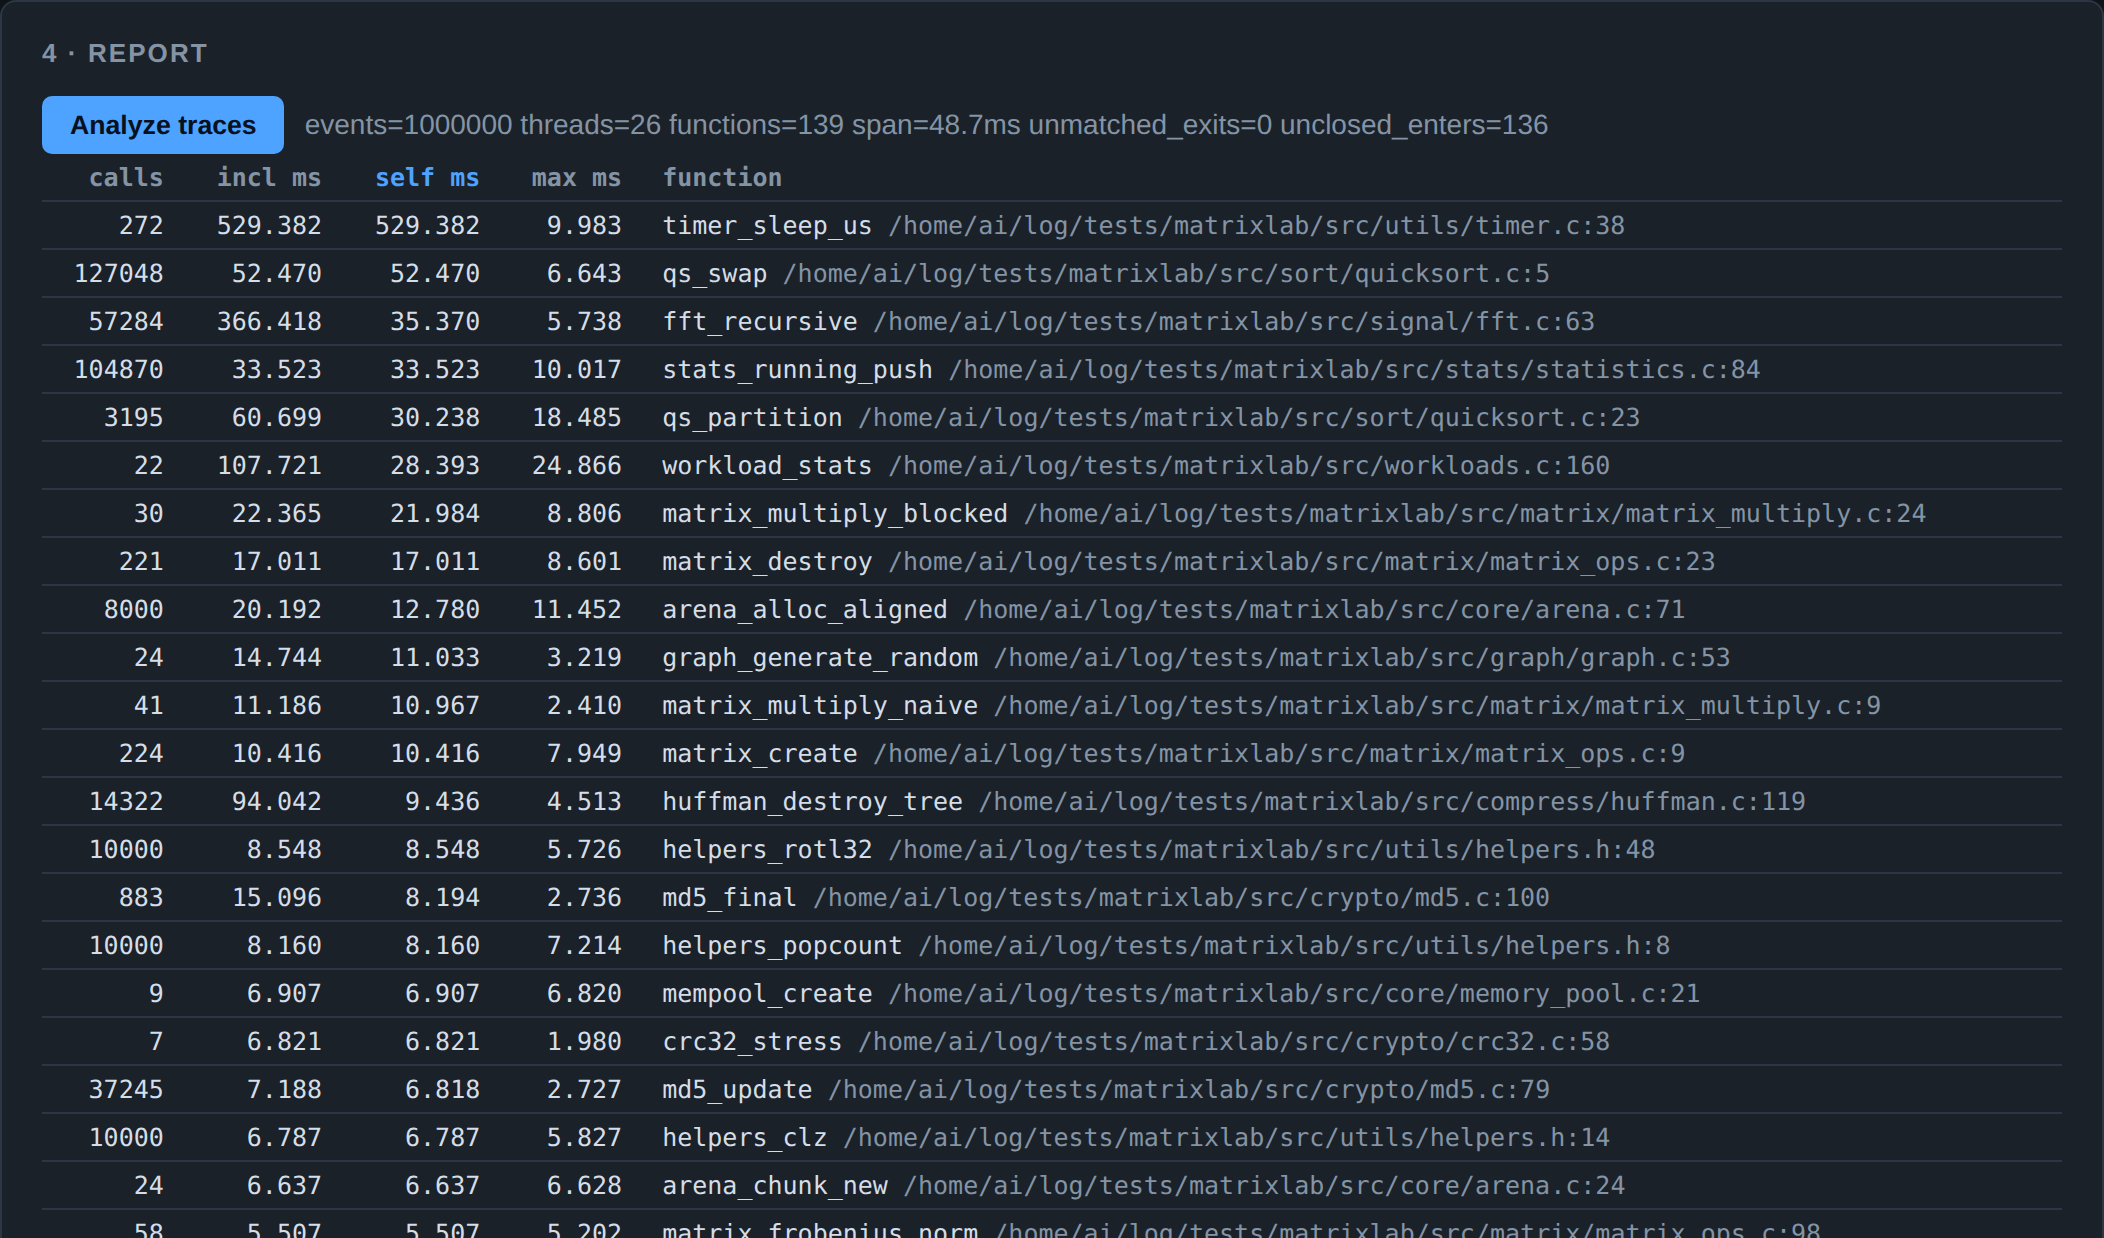
make instrumentor the CMake flow) with the full log captured, then run the binary withTRACE_ENABLE=1, aTRACE_MAXcap and a timeout. - Report — the analyzer result as a sortable table: calls, inclusive
and self time, plus the per-call
p50,p99andmax, with the summary line turning green onunmatched_exits=0. Anything that cut the capture short is called out above the table. - Flame graph — the same collapsed stacks the CLI exports, rendered in the browser. Each frame is as wide as the time spent inside it; click one to zoom into that subtree and click it again to zoom back out.
Config Builder tab
A visual editor for trace.config — no pattern syntax to memorize.
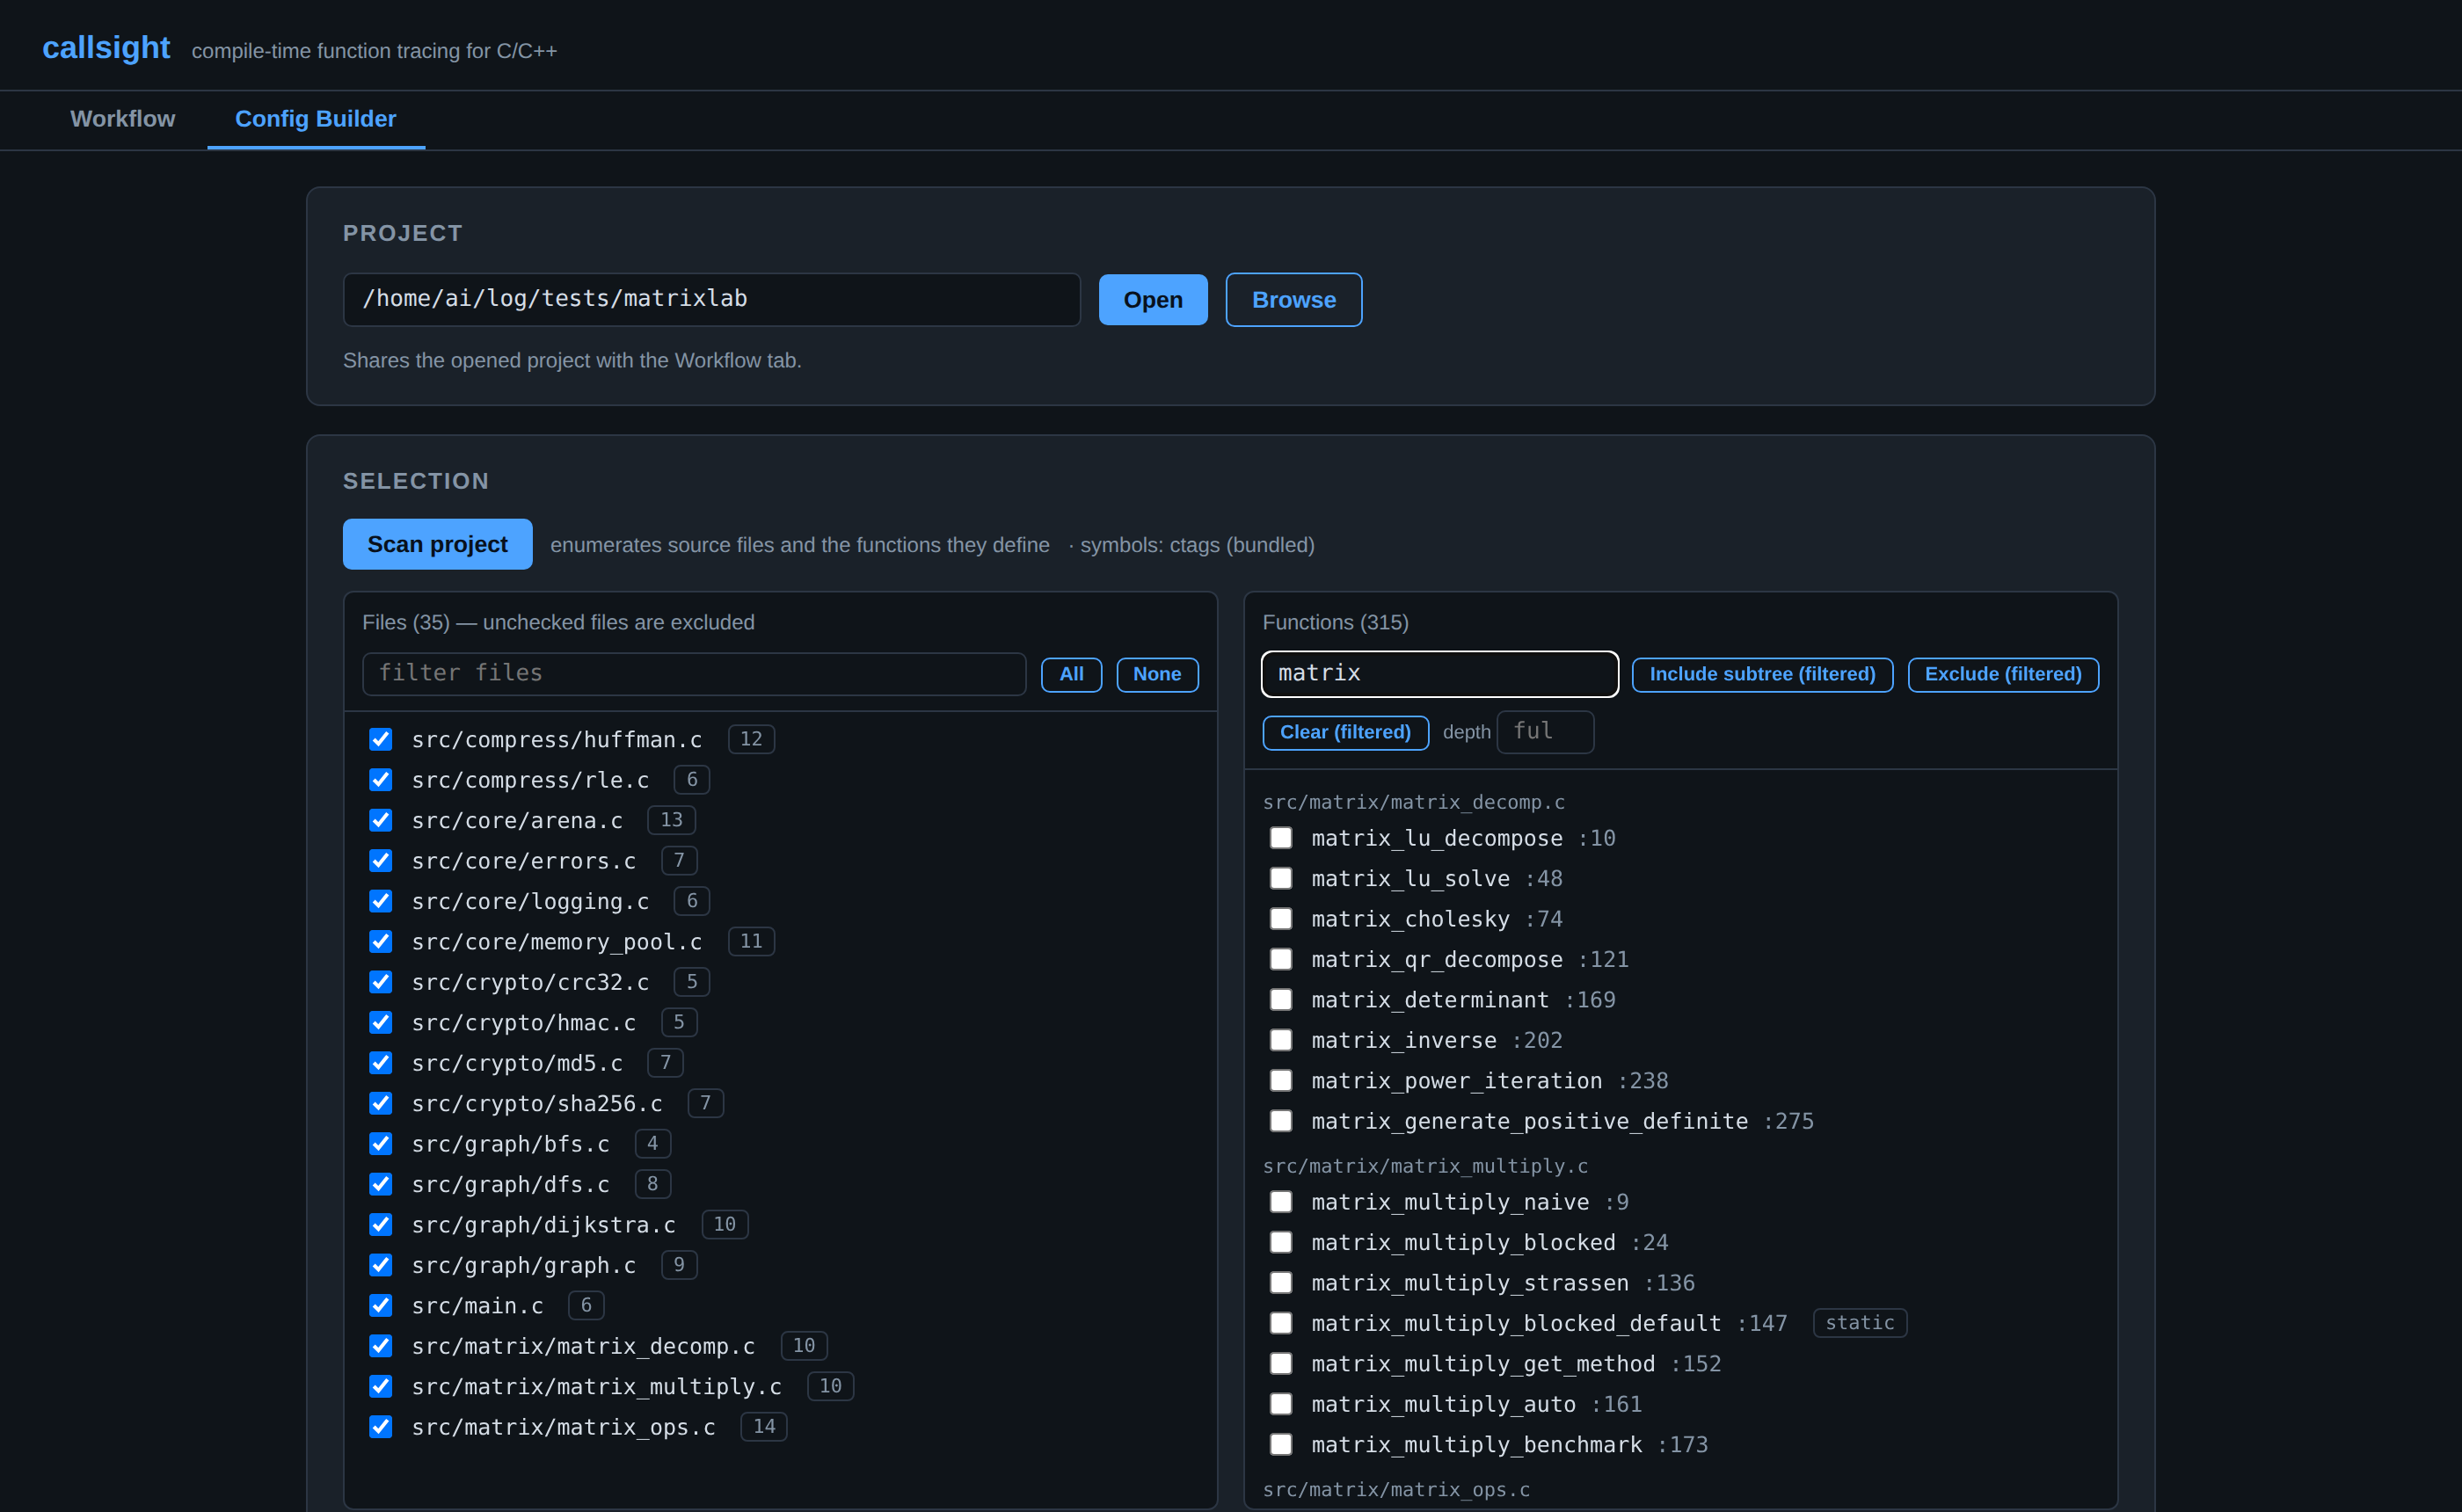
symbols: badge names the backend that produced the scan.- Pick a folder and scan. The builder enumerates every source file and
the functions defined in them. It uses
ctagswhen available — asymbols:badge next to the Scan button tells you which backend served the scan: system ctags, the bundled static copy (auto-downloaded on first scan), or the built-in regex fallback. - Searchable checkbox panes — one for files, one for functions. Filter either list and tick what you care about.
- Per-function actions — for each selected function choose
include-subtree (expands through the static call graph, like
include-func), exclude, or count. - Preview — writes the generated config, then dry-runs the selection against it: how many sources would be instrumented versus excluded with your current choices. (The write is required — the dry run reads the saved file.)
- Apply — writes
trace.configinto the project, ready for the next instrumented build.
Both buttons ask before overwriting an existing config whose content differs.
Choosing what to count
The Count action selects functions for hardware counters. Because a counter read is not free — and on arm64 it is a syscall of microseconds — the panel below the panes exists to stop you pointing them somewhere useless:
- A capability banner from the actual machine. The server opens a real counter and runs a known loop before the panel offers anything. Where the PMU is not exposed — most containers — Count is disabled and says why, rather than letting you configure a run that would report zeros.
- Event checkboxes, capped at three. A fourth is refused: past the PMU's registers the kernel time-slices the events and scales the counts, which turns exact numbers into estimates.
- Each function's median duration from the last analyzed run, shown on its row. Anything below the floor is dimmed and badged too short.
- Check selection resolves the names against the built binary and projects the cost: two reads per counted call, so the previous run's call counts give a real number — “+4.2 ms on a run that took 8000 ms” — before you run rather than after. It also names anything that did not resolve, or that carries no instrumentation hooks and therefore can never be counted.
Live tab
A report that fills in while the program is still running, instead of after it exits.
- Run & watch launches the binary from the UI and reads its trace as it grows.
- Watch a directory follows one that something else is filling — a
callsight servereceiving from a remote device, which is where this earns its keep: a 32-bit or big-endian board streaming in, symbolized and counted on arrival.
The header shows elapsed time, thread and function counts and an events-per-second
sparkline; the table is the current top functions by self time, with
counter columns alongside when the capture has them. Stop sends
SIGTERM first, so a clean exit still flushes each thread's buffered tail.
Each refresh reads only the bytes the trace files have gained since the last one — a partial final record is resumed rather than dropped — so the cost is proportional to new events, not to the size of the trace. A capture heading for millions of events refreshes just as cheaply at the end as at the start.
Symbol enumeration
The builder needs to know what functions a project defines. In order of preference:
- Universal Ctags on
PATH— accurate parsing, withstaticdetection. - The bundled static ctags — downloaded on first scan into
~/.callsight/binand checksum-verified. Run it ahead of time withcallsight provision, or inspect what would be used with the same command. - The regex fallback — the same heuristic parser that backs
include-func. Always available, no dependency.
Notes
127.0.0.1 by default. --host 0.0.0.0 exposes it on the network —
only do that on a trusted one.
- Everything the UI does goes through the same functions as the CLI. There are no behavior differences between driving it from the browser and from a shell.
- CMake is fetched ephemerally through
uvxwhen the host has none, so a CMake project works without installing CMake system-wide. - The UI's dependencies (FastAPI, uvicorn) live in the
uiextra; the core package stays stdlib-only.